
Fig. 4.
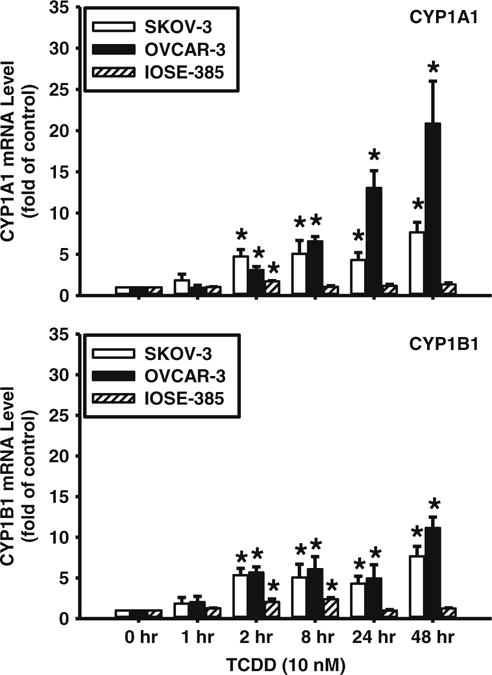
Effects of TCDD on CYP1A1 mRNA expression in SKOV-3, OVCAR-3 and IOSE-385 cells as detected by qPCR. Cells were treated with a single dose of TCDD (10 nM) up to 48 h and total mRNA extracts were subjected to qPCR. Data normalized to β-actin are expressed as means±SEM fold of the time 0 control (n=3–4). *: Different from the time 0 control (p<0.05)