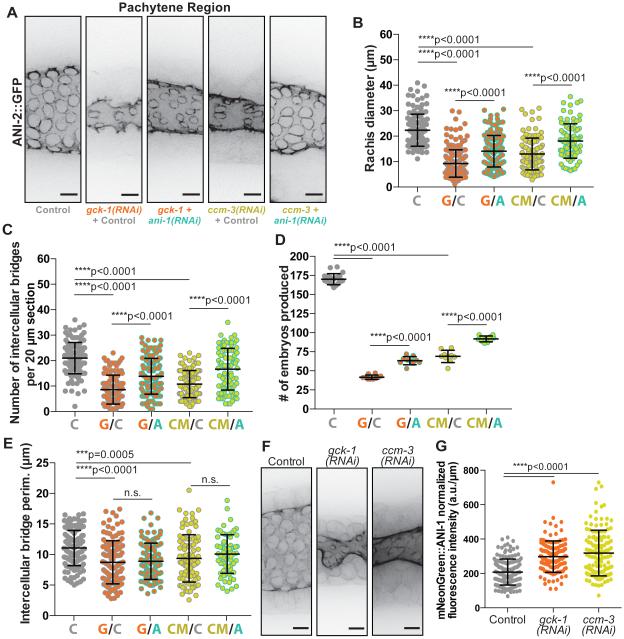
Figure 3. GCK-1 and CCM-3 depletion germline phenotypes are dependent on ANI-1.
(A) Representative images (max intensity projections) of intercellular bridges labeled with ANI-2::GFP in control, “single” depletion (gck-1(RNAi)+control; ccm-3(RNAi)+control), and double depletion (gck-1 + ani-1(RNAi); ccm-3 + ani-1(RNAi)) germlines. In this and the following experiments the control RNAi targets a mCherry tagged plasma membrane probe which is expressed, but non-essential. This control is included in “single” depletions as a standardizing variable to account for the increased number of targets in the +ani-1(RNAi) double depletions. Scale bars represent 5 μm.
(B) Average rachis diameter for 20 μm sections of pachytene in control (n=127 sections), “single” depletion (gck-1(RNAi)+control, G/C, n=126; ccm-3(RNAi)+control, CM/C, n=104), and double depletion (gck-1 + ani-1(RNAi), G/A, n=117; ccm-3 + ani-1(RNAi), CM/A, n=86) germlines. Rachis diameter was significantly reduced in gck-1(RNAi)+control (****p<0.0001) and ccm-3(RNAi)+control (****p<0.0001) worms compared to control worms. Double depletion of either GCK-1 or CCM-3 with ANI-1 (G/A; CM/A) significantly increased rachis diameter relative to “single” depletions (G/C; CM/C respectively) with ****p<0.0001 in both instances.
(C) Number of intercellular bridges per 20 μm section of pachytene length in control (n=126 sections), “single” depletion (gck-1(RNAi)+control, G/C, n=123; ccm-3(RNAi)+control, CM/C, n=104), and double depletion (gck-1 + ani-1(RNAi), G/A, n=129; ccm-3 + ani-1(RNAi), CM/A, n=86) germlines. The number of intercellular bridges was significantly reduced in gck-1(RNAi)+control (****p<0.0001) and ccm-3(RNAi)+control (****p<0.0001) worms compared to control worms. Double depletion of either GCK-1 or CCM-3 with ANI-1 (G/A; CM/A) significantly increased intercellular bridge number relative to “single” depletions (G/C; CM/C respectively) with ****p<0.0001 in both instances.
(D) Number of embryos produced (brood size) per worm in 48 hrs by control (n=20 worms), “single” depletion (gck-1(RNAi)+control, G/C, n=10; ccm-3(RNAi)+control, CM/C, n=9), and double depletion (gck-1 + ani-1(RNAi), G/A, n=10; ccm-3 + ani-1(RNAi), CM/A, n=10) worms. Brood size was significantly reduced in gck-1(RNAi)+control (****p<0.0001) and ccm-3(RNAi)+control (****p<0.0001) worms compared to control worms. Double depletion of either GCK-1 or CCM-3 with ANI-1 (G/A; CM/A) significantly increased brood size relative to “single” depletions (G/C; CM/C respectively) with ****p<0.0001 in both instances.
(E) Average intercellular bridge perimeter for 20μm sections of pachytene in control (n=127 sections), “ single ” depletion (gck-1(RNAi)+control, G/C, n=122; ccm-3(RNAi)+control, CM/C, n=93), and double depletion (gck-1 + ani-1(RNAi), G/A, n=108; ccm-3 + ani-1(RNAi), CM/A, n=70). Bridge size was significantly reduced in gck-1(RNAi)+control (****p<0.0001) and ccm-3(RNAi)+control (***p=0.0005) worms compared to control worms. Double depletion of either GCK-1 or CCM-3 with ANI-1 (G/A; CM/A) had no significant effect on bridge size compared to “single” depletions (G/C; CM/C respectively) in both instances (p=0.6978 and p=0.2074 respectively).
(F) Representative images (max intensity projections) of mNeonGreen::ANI-1 localization to intercellular bridges in control, GCK-1 depleted, and CCM-3 depleted germlines. Scale bars represent 5 μm.
(G) Average fluorescence intensity (a.u./μm) of mNeonGreen::ANI-1 on intercellular bridges in control (n=156 bridges), GCK-1 depleted (n=127), and CCM-3 depleted (n=130) germlines. mNeonGreen::ANI-1 average fluorescence intensity is significantly increased following GCK-1 (****p<0.0001) or CCM-3 (****p<0.0001) depletion relative to controls.
See also Figure S2.

