Figure 3.

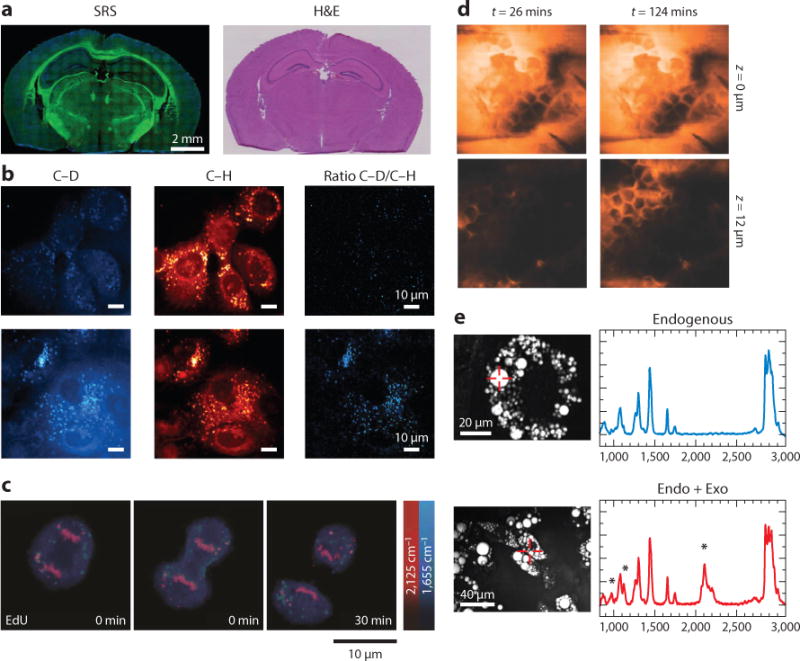
Applications of single-frequency CRS microscopy. (a) SRS and H&E images of frozen sections of normal mouse brain. Lipids are colored green and proteins are blue. (b) Upper and lower panels show SRS images of normal immortalized pancreatic epithelial cells and pancreatic cancer cells treated with 25-mM glucose-d7 in glucose-free media and with 10% FBS, respectively. Lipogenesis increased in pancreatic cancer cells compared with normal cells. (c) Time-lapse SRS images of a dividing cell that was incubated with 100-μM alkyne-tagged thymidine analog EdU. (d) SRS images of the penetration dynamics of deuterated propylene glycol across the stratum corneum at different depths. (e) Left panels show CARS images of 3T3-L1 cells without and with incubation of 50-μM deuterated palmitic acid. Right panels show the spontaneous Raman spectra from the indicated positions in the CARS images, and the peak at 2,133 cm−1 was from deuterated palmitic acid. The Raman intensity indicated the fractions of exogenous and endogenous fatty acid in the lipid droplets. Panels a, b, c, d, and e are reprinted with permission from References 106, 111, 108, 112, and 114, respectively. Abbreviations: CARS, coherent anti-Stokes Raman scattering; CRS, coherent Raman scattering; EdU, 5-ethynyl-2′-deoxyuridine; Endo + Exo, endogenous plus exogenous; FBS, fetal bovine serum; H&E, hematoxylin and eosin; SRS, stimulated Raman scattering.
