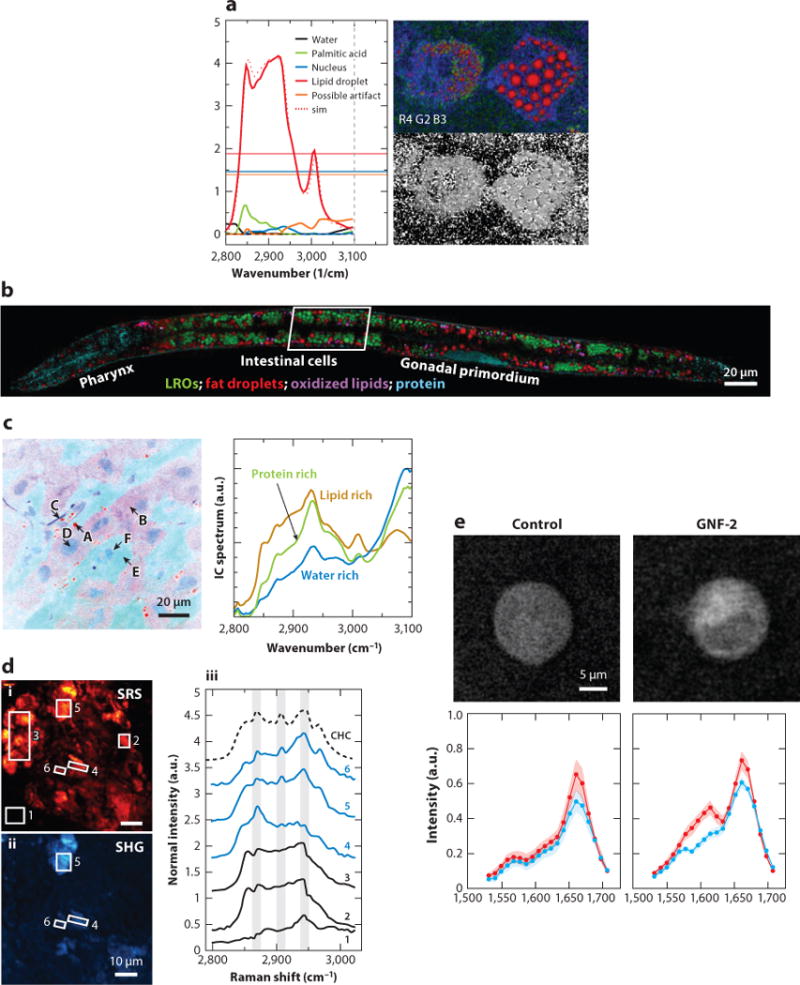
Figure 4.

Applications of frame-by-frame hyperspectral CRS microscopy. (a) Hyperspectral CARS image of human adipose-derived stem cells fed with palmitic acid and α-linolenic acid. Five components, including water, palmitic acid, nucleus, lipid droplet, and a possible artifact, were identified. (b) Compositional analysis of intracellular compartments in a Caenorhabditis elegans daf-2 mutant by hyperspectral SRS images. MCR analysis distinguished neutral fat droplets, LROs, oxidized lipids, and protein. (c) The left panel is a SRS spectral image of rat liver tissue and the spectra of independent components. The locations A–F indicated by arrows show various structures with different pseudocolors. The right panel shows the distribution of lipid-rich, water-rich, and protein-rich regions. (d) The left panels (i, ii) show SRS and SHG images of cholesterol crystal in atherosclerotic plaques of a mouse. The right panel (iii) shows SRS spectra of regions indicated in the left panels. SHG-active areas exhibit spectra consistent with the spectral signature of CHC, whereas amorphous lipophilic compounds in area 3 exhibit a weak SHG signal, suggesting no preferred orientation. (e) Hyperspectral SRS images of BaF3/BCR-ABL1 untreated cells and cells treated with the drug GNF-2. Drug accumulation led spectra of cytoplasm to increase at ∼1,600 cm−1. Panels a, b, c, d, and e are reprinted with permission from References 123, 75, 29, 26, and 128, respectively. Abbreviations: CARS, coherent anti-Stokes Raman scattering; CHC, cholesterol crystal; CRS, coherent Raman scattering; LRO, lysosome-related organelle; MCR, multivariate curve resolution; SHG, second harmonic generation; sim, simulation; SRS, stimulated Raman scattering.
