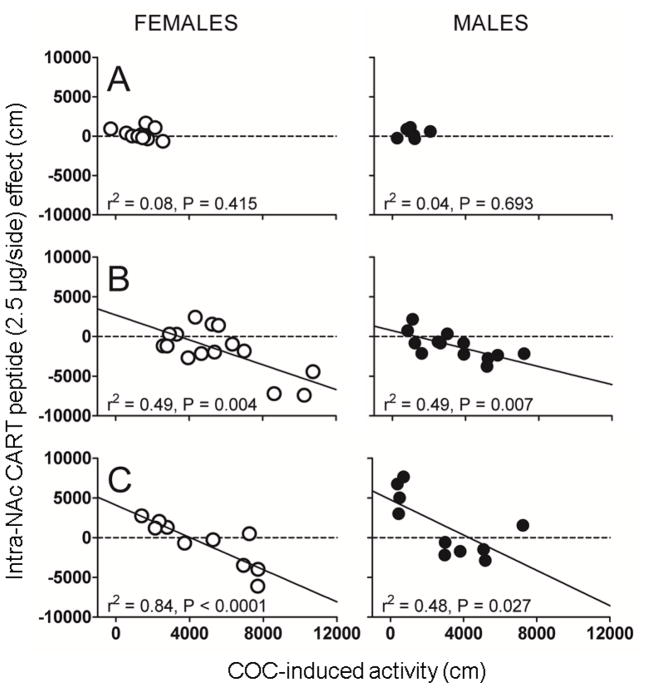
Fig 2. Correlations between the intra-NAc CART peptide (2.5 μg/side) effect and COC-induced LMA in male and female rats: Effect of sex and varying the dose of COC.
CART 55-102 (2.5 μg) and saline were administered bilaterally intra-NAc immediately before an i.p. injection of different doses of COC in males and females and total distance traveled in 10 min (COC-induced LMA) was measured. Panels A, B and C correspond to COC doses of 0, 10 and 15 mg/kg, respectively. The x-axis represents COC-induced LMA (cm), and the y-axis represents the CART peptide effect (cm). COC-induced activity (independent variable) and CART peptide effect (dependent variable) data were analyzed using linear regression analysis. All linear regression analyses passed the normality and equality of variance tests (P > 0.05). Each data point in the figure represents data from one animal. The correlation coefficients (Pearson’s r2) and P values are shown on the graphs. Note: For the females, one data point corresponding to a CART peptide effect of −9161 and COC-15-induced LMA of 12716 is just outside the axis, but is included in the analysis. Linear regression revealed the following values: F1, 13 = 12.627, P = 0.004, r = −0.702, n = 15 (Fig 2B, females, slope = −0.7820 ± 0.2201) and F1, 9 = 46.914, P < 0.001, r = −0.916, n = 11 (Fig 2C, females, slope = −1.015 ± 0.1481); F1, 11 = 10.703, P = 0.007, r = −0.702, n = 13 (Fig 2B, males, slope = −0.5664 ± 0.1731); F1, 8 = 7.318, P = 0.027, r = −0.691, n = 10 (Fig 2C, males, slope = −1.112 ± 0.4110). The data shows that there was no significant effect of CART peptide on LMA when no COC was administered (A, males and females), but there was a significant relationship between COC-induced LMA and the CART peptide effect (B, C, males and females).

