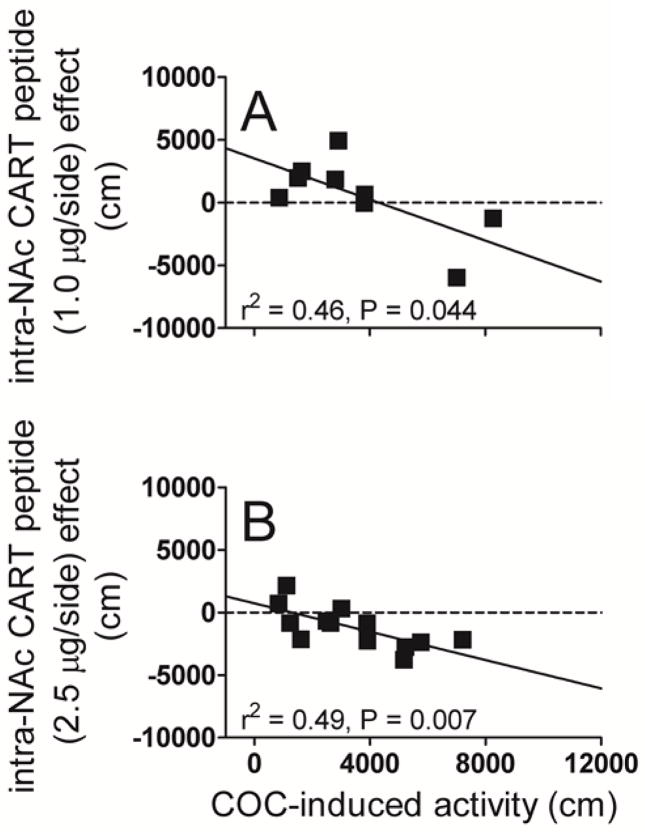
Fig 3. Correlations between the intra-NAc CART peptide (1.0 or 2.5 μg/side.) effect and COC (10 mg/kg i.p.)-induced LMA in male rats: Effect of varying the dose of intra-NAc CART peptide.
All animals (males only in this comparison) were used for all treatments (counterbalanced design) and served as their own controls for both psychostimulant and CART peptide. CART 55-102 (1.0 or 2.5 μg) saline alone were administered bilaterally intra-NAc immediately before an i.p. injection of COC (10 mg/kg) and total distance traveled in 10 min (COC-induced LMA) was measured. The x-axis represents COC-induced LMA (cm), and the y-axis represents the CART peptide effect (cm). The points on the graphs represent individual subjects. COC-induced activity and CART peptide effect data were analyzed using linear regression. The correlation coefficients (Pearson’s r2) and P values are shown on the graphs. The linear regression analysis (Fig 3A) passed the normality and equality of variance tests (P = 0.846). Linear regression revealed the following values for the relationship between CART peptide effect (1.0 μg/side) and COC-induced activity: F1, 7 = 6.032, P = 0.044, r = −0.680, n = 9 (Fig 3A, slope = −0.8174 ± 0.3328). The F value, degrees of freedom, P value, r and slope for CART peptide 2.5 μg/side dose shown above has been previously reported in Fig 2B (males). There was a correlation between COC-induced LMA and intra-NAc CART peptide (both 1.0 μg and 2.5 μg) effect for COC (10 mg/kg i.p.). Note that the data in Fig. 3B are the same as in Fig. 2B (males).

