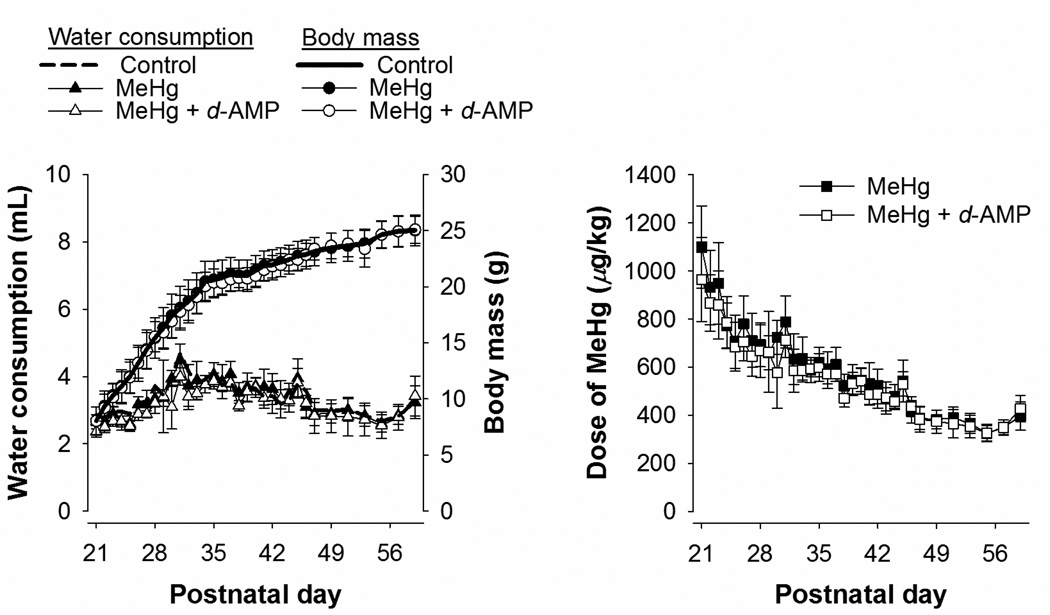
Figure 2.
Left panel: Mean (±SD) estimated water consumption (triangles, left axis) and body mass (circles, right axis) for mice exposed to MeHg alone and MeHg + d-AMP during adolescence. Mean water consumption and body mass for Control are shown also for comparison. Right panel: Mean estimated dose of MeHg for mice exposed to MeHg alone and MeHg + d-AMP during adolescence. Note all error bars represent one standard deviation.

