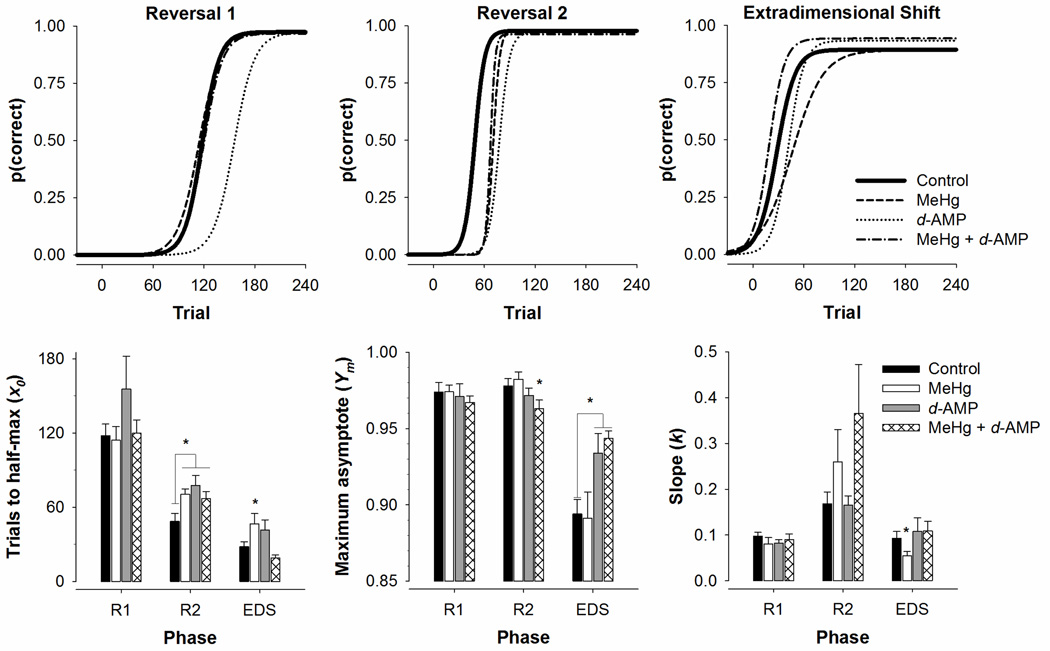
Figure 4.
Top row: Probability of a correct response [p (correct)] as a function of trial across each experimental phase for the four treatment groups. Lines were generated using mean parameter estimates from Eq. 1.
Bottom row: Parameter estimates (+SEM) derived from Eq. 1 of trials to half-max (left), asymptotic accuracy (middle), and slope of the transition (right) for the first reversal (R1), second reversal (R2), and extradimensional shift (EDS). *p < .05 relative to Control

