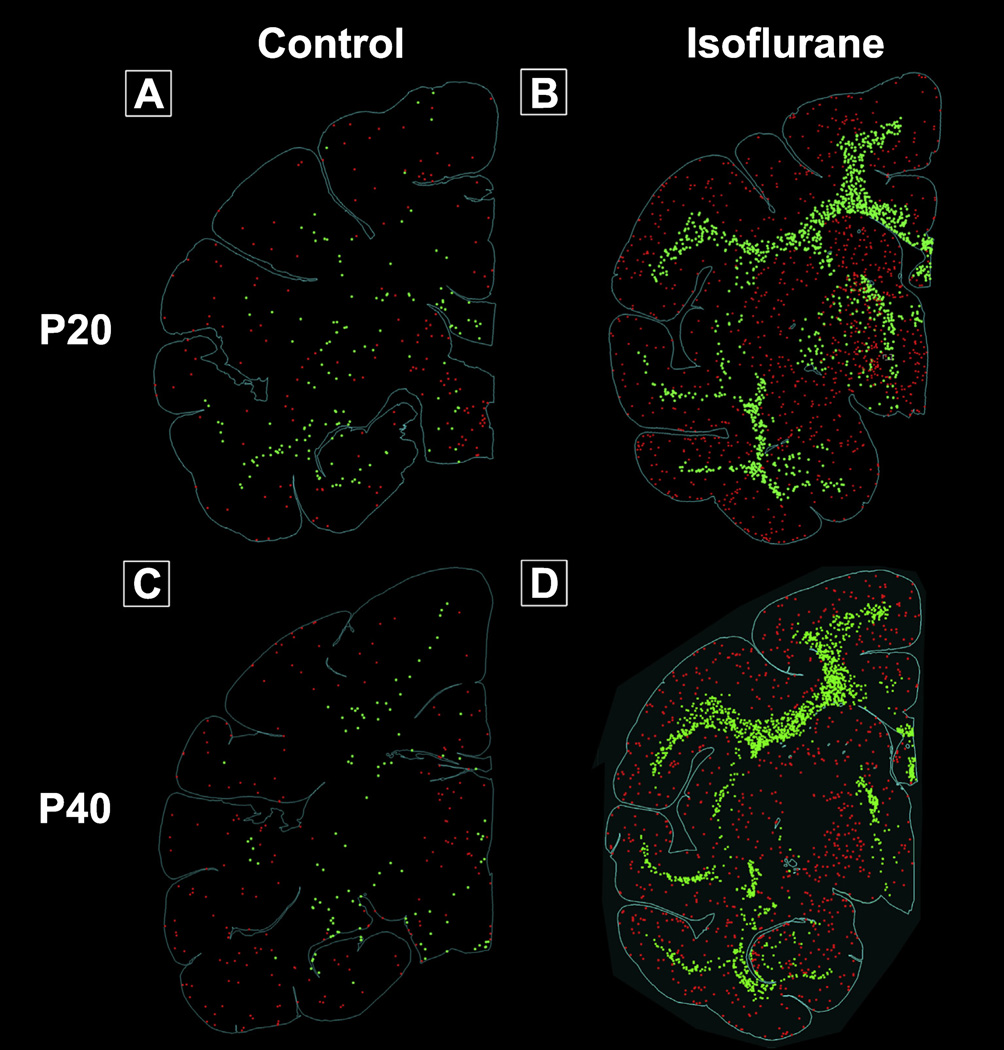
Fig. 1.
Computer plots of representative brain slices portraying apoptotic cells. See text for further details. Panel A: Control, P20; Panel B: Isoflurane, P20; Panel C: Control P40; Panel D: Isoflurane P40. Red: apoptotic neurons; green: apoptotic oligodendrocytes. (For interpretation of the references to colour in this figure legend, the reader is referred to the web version of this article.)

