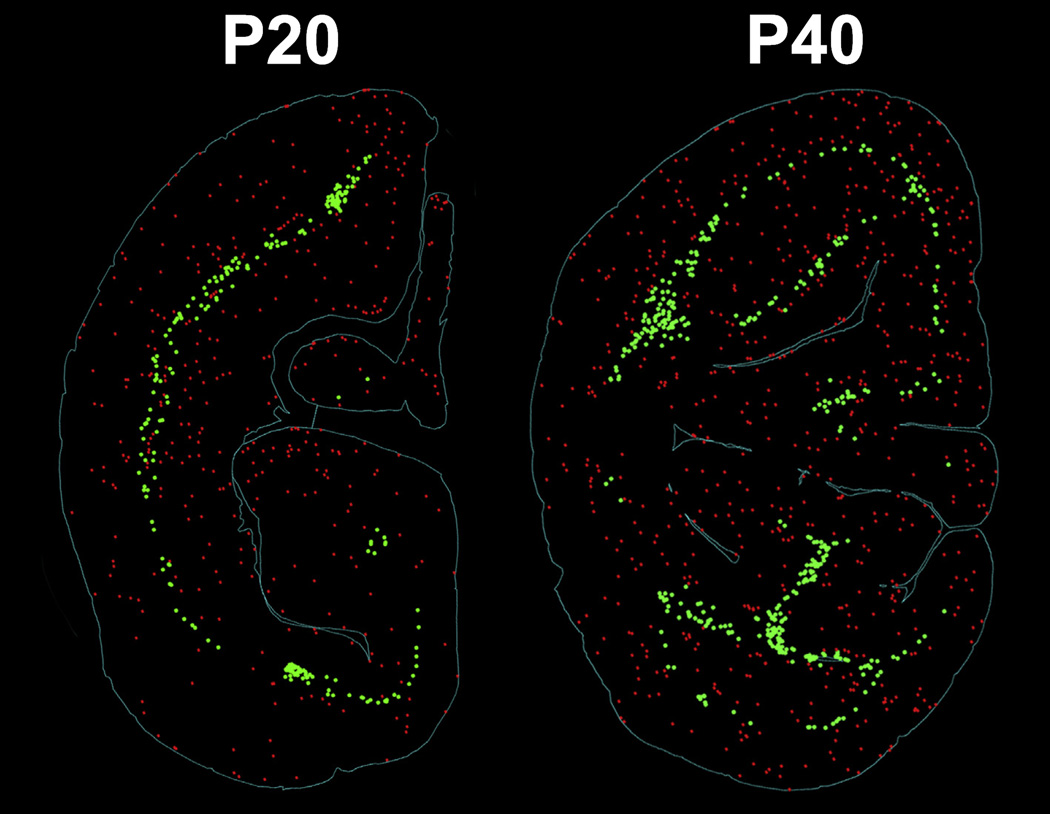
Fig. 2.
Computer plots of representative brain slices portraying representative patterns of neuroapoptosis in the cortex of infant NHPs. The images represent the isotropic and non-laminar apoptotic cortical patterning following isoflurane exposure at P20 (left) and P40 (right). This is in contrast to the laminar pattern of gray matter apoptosis that we previously reported in isoflurane-exposed P6NHPs (Brambrink et al., 2012a; Creeley et al., 2013). Red: apoptotic neurons; green: apoptotic oligodendrocytes. (For interpretation of the references to colour in this figure legend, the reader is referred to the web version of this article.)

