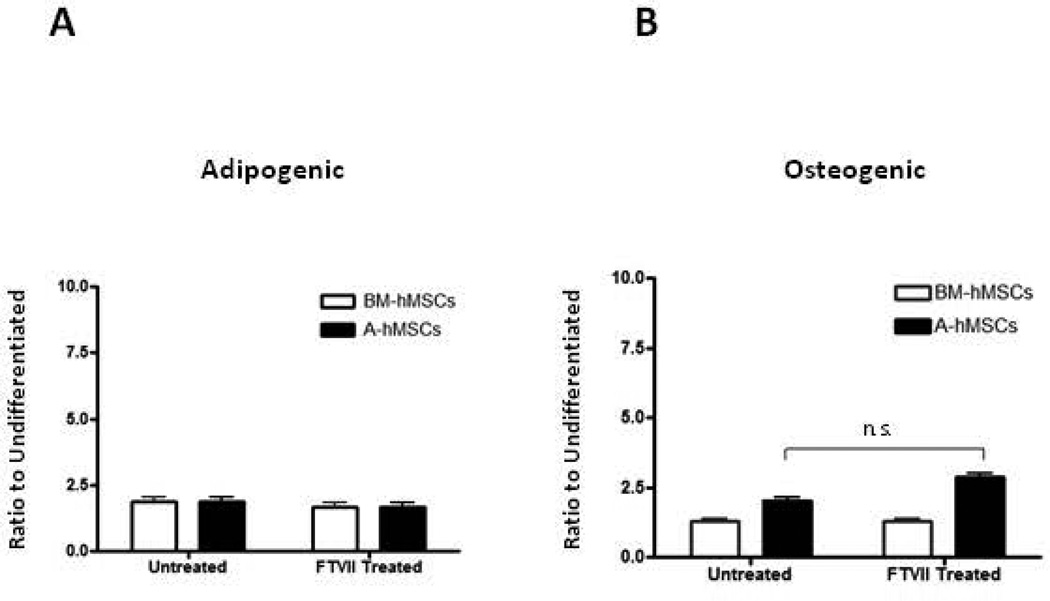
Figure 6. Analysis of differentiation potential of hMSCs after FTVII treatment.
(A): Adipogenic differentiation potential of untreated versus FTVII-treated BM-hMSCs (white bars) and A-hMSCs (black bars). Intracellular lipids droplets enrichment of hMSCs under adipogenic differentiation conditions. Data presented as the ratio of Oil Red O staining under adipogenic conditions relative to untreated controls (B). Osteogenic differentiation potential of untreated versus FTVII-treated BM-hMSCs (white bars) and A-hMSCs (black bars) under osteogenic differentiation conditions. Data presented as the ratio of Alizarin Red S staining under osteogenic conditions relative to untreated controls. Values are reported as mean ± SEM. Data are representative of three independent experiments. Abbreviations: FTVII, Fucosyltransferase FTVII; BM-hMSCs, Bone Marrow-derived human Mesenchymal Stem Cells; A-hMSCs, Adipose-derived human Mesenchymal Stem Cells.

