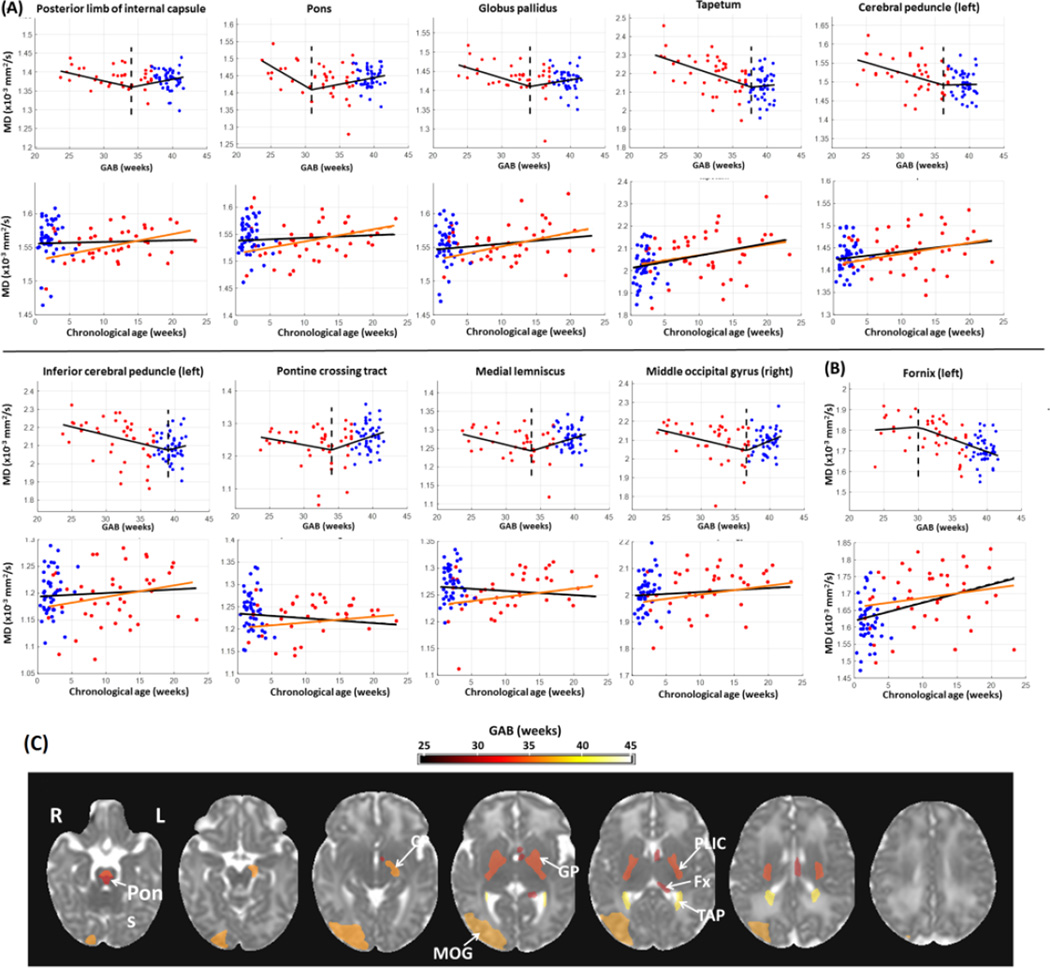
Figure 3.
Change point analysis of T2 relaxation times (corrected for PMA at scan and gender) in the structures with significant change points (familywise p<0.05). (A) First row for each structure: change of T2 relaxation time against GAB, after correcting for PMA at scan and gender. The red and blue dots denote data from preterm and term-born neonates, respectively. The black lines show T2 relaxation time fitted to GAB only, and dashed lines indicate the change points. Second row for each structure: change of T2 relaxation time against chronological age, after correcting for PMA at scan and gender. The black lines indicated the linear regression between T2 relaxation time and chronological age with both the term and preterm-born infants, and the orange lines showed the linear fitting with only the preterm data. For the structures that were bilaterally significant, only one side (left side) was presented; for those that were significant only in one side, the laterality is indicated in the plots. In all regions (n = 11), T2 relaxation times increased slightly before the change point and then shortened with GAB after the change point. (B): Change point values of T2 relaxation time in regions that showed significant change points (FDR p<0.05), overlaid on the JHU neonate T2-weighted atlas. The color bar indicates the change points in units of GAB (weeks). Abbreviations: MFOG – medial fronto-orbaital gyrus; RG – gyrus rectus; SCP –superior cerebellar peduncle; Fx –fornix; PrCu – precuneus; PoCG –postcentral gyrus.

