
Fig. 1.
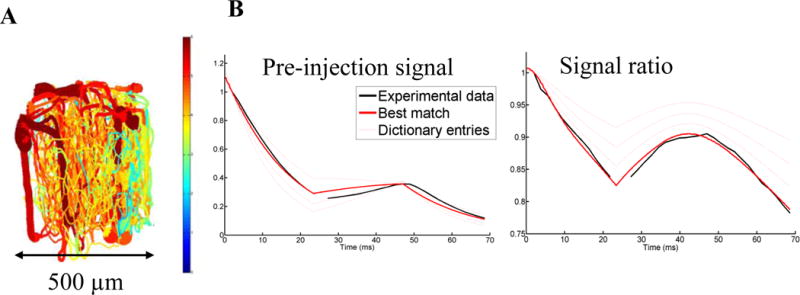
Illustration of vMRF methodology. A. Representation of a realistic angiogram, used to generate by deformations a dictionary of MR signals. B. Sample modeling of cortical mouse vMRF data (black line) to the best matching entry in the dictionary (thick red line), with the thin red lines representing 3 out of the 175 thousand other dictionary entries. From this model, simulated parameters which generated that entry are extracted, e.g. for this match: SatO2 = 52.7%, mean vessel radius = 7.4 μm, CBV = 8.0%, SPION concentration = 3.0 and ΔB0 = 0.0015.