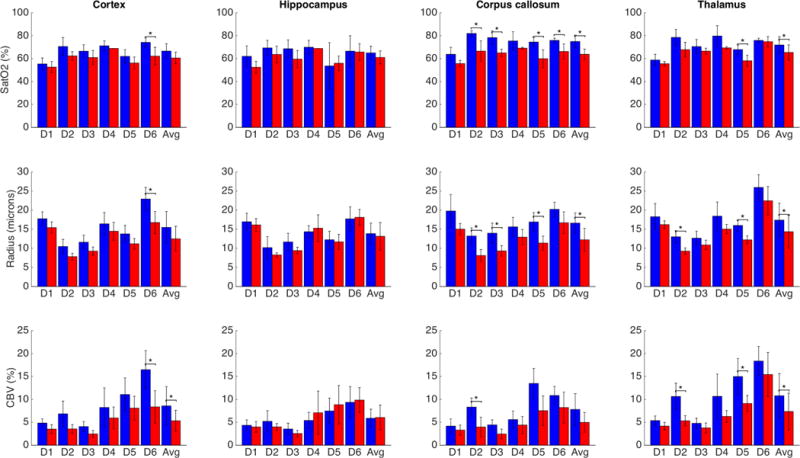
Fig. 6.

Results of paired t-tests for 4 regions of interest for the 3 physiological parameters. SatO2 and Radius were significantly higher in white matter (corpus callosum and thalamus) for the mean of the extracted parameters. Blue bars (darker when printed in grayscale): WT mice; red bars: ATX mice.
*: p < 0.05 Bonferroni corrected.
