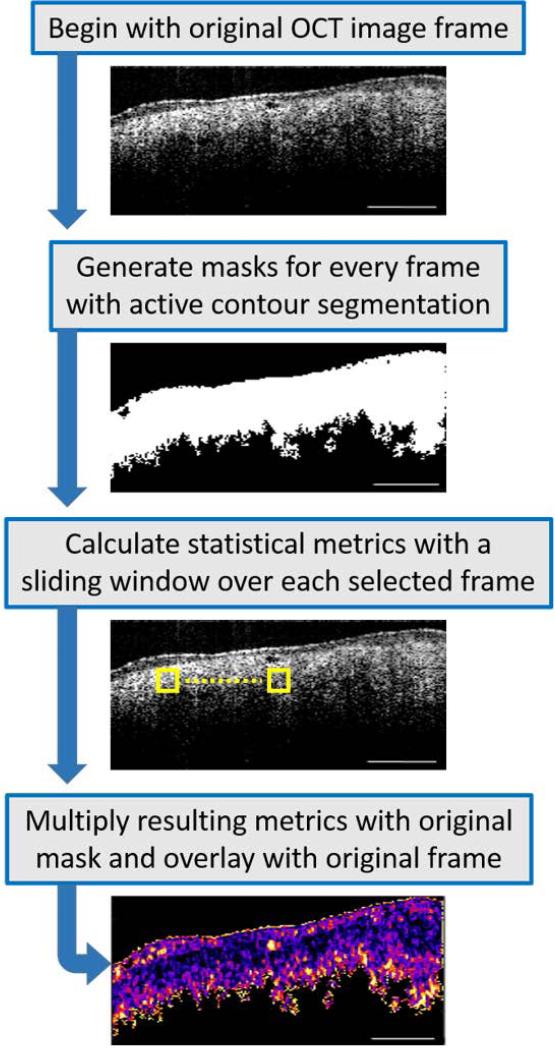
Fig. 1.
Image processing flowchart. Out of 600 images acquired from each imaged site, 10 were selected, ensuring that there was an adequate separation between the chosen images. Segmentation masks were then generated by choosing areas of interest, avoiding areas of saturation and background noise. An active contour was then applied to every mask. A sliding window (yellow box) was applied over every image to determine the statistical metrics of Coefficient of Variation, Standard Deviation, and Range. The results were then multiplied with each mask and overlaid with the original frame. Statistical comparisons between tissue types were made between these resulting B-scan images.

