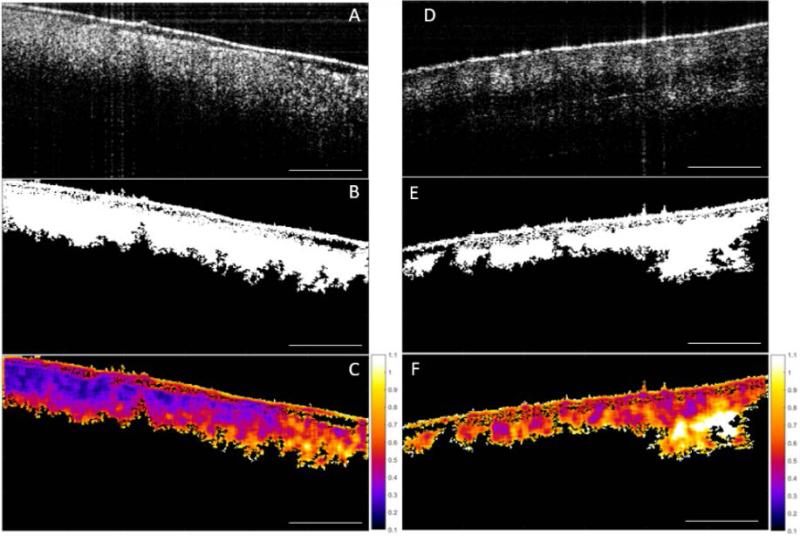
Fig. 5.
Image processing sequence for the descriptive Coefficient of Variation (CV) statistical metric. (A) Original OCT image of sarcoma, (B) corresponding mask, and (C) calculated CV. (D) Raw OCT image of muscle, (E) corresponding mask, and (F) calculated CV. Scale bar represents 1 mm and the color bar ranges from 0.1 to 1.1 in steps of 0.1.

