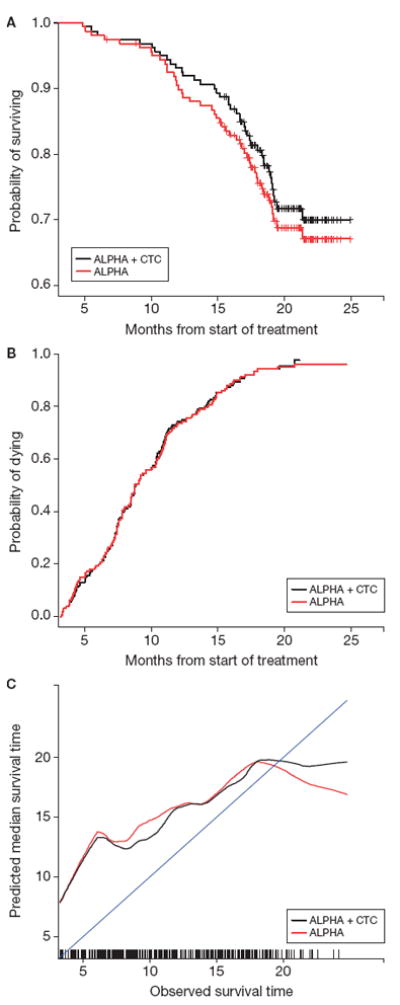
Figure 2.

COU-AA-301 negative (A) and positive (B) predictive value and calibration (C) curves. Note: Negative predictive value includes patients in the lowest quartile and positive predictive value those in the highest of risk scores within each model. An improvement in the negative predictive value among these low-risk patients would be shown by an increase in the Kaplan-Meier estimate. An improvement in the positive predictive value among these high-risk patients would be demonstrated by an increase in the one minus Kaplan-Meier estimate. Calibration represents the relationship between observed survival time and the median predicted survival time. A model with good calibration would closely approximate the 45° line through the origin.
