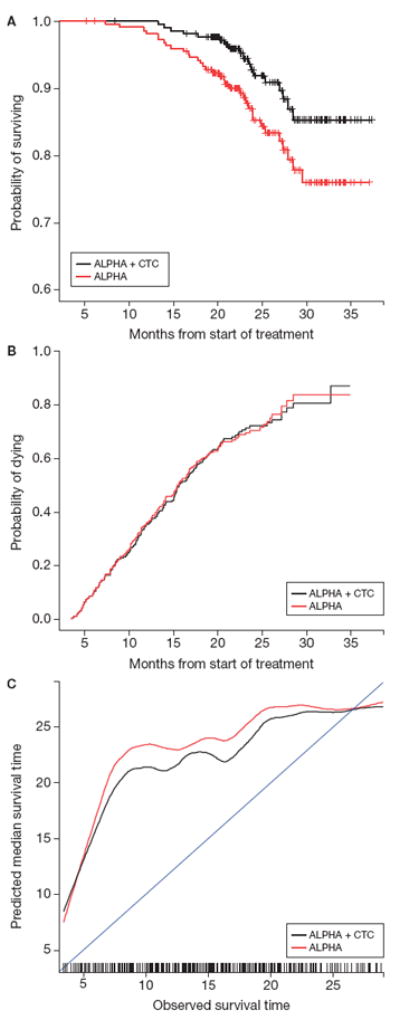
Figure 3.

ELM-PC4 negative (A) and positive (B) predictive value and calibration (c) curves. Note: Negative predictive value includes patients in the lowest quartile of risk scores within each model; positive predictive value includes patients in the highest quartile of risk scores within each model; calibration represents the relationship between observed survival time and the median predicted survival time.
