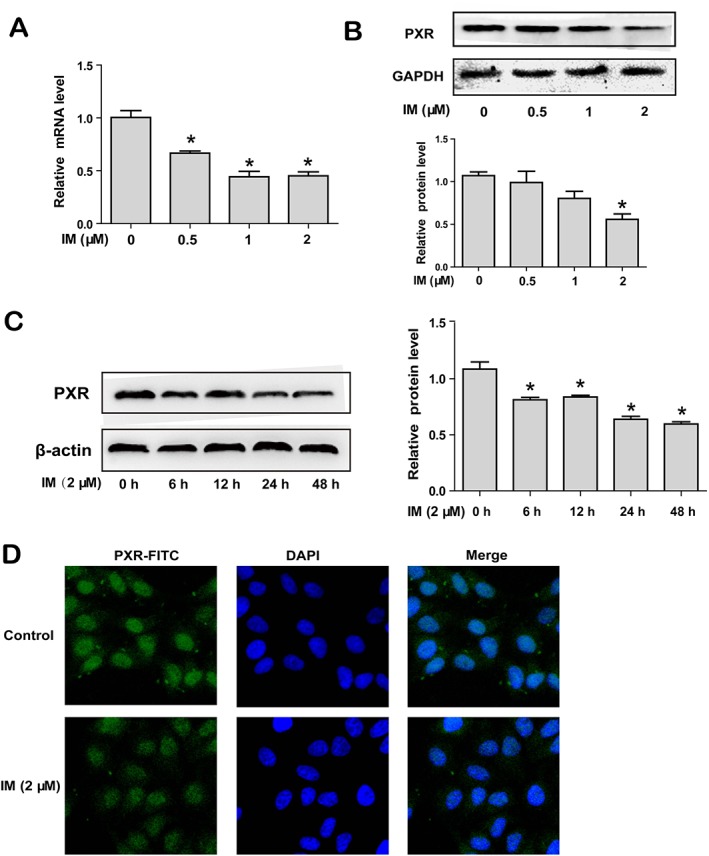
Figure 4.

IM down‐regulates the expression of PXR. (A–B) HepG2 cells were treated with IM (0, 0.5, 1 or 2 μM) for 24 h. PXR mRNA levels were investigated by qRT‐PCR (A), and protein expression was evaluated by Western blot (B). (C) HepG2 cells were treated with 2 μM IM for 0, 6, 12, 24 or 48 h, and PXR protein levels were investigated by Western blot. (D) HepG2 cells were treated with or without 2 μM IM for 24 h, and fluorescence intensity of PXR was detected by immunofluorescence analysis (400×). Data are expressed as mean ± SEM (n = 5). *P < 0.05, significantly different from control.
