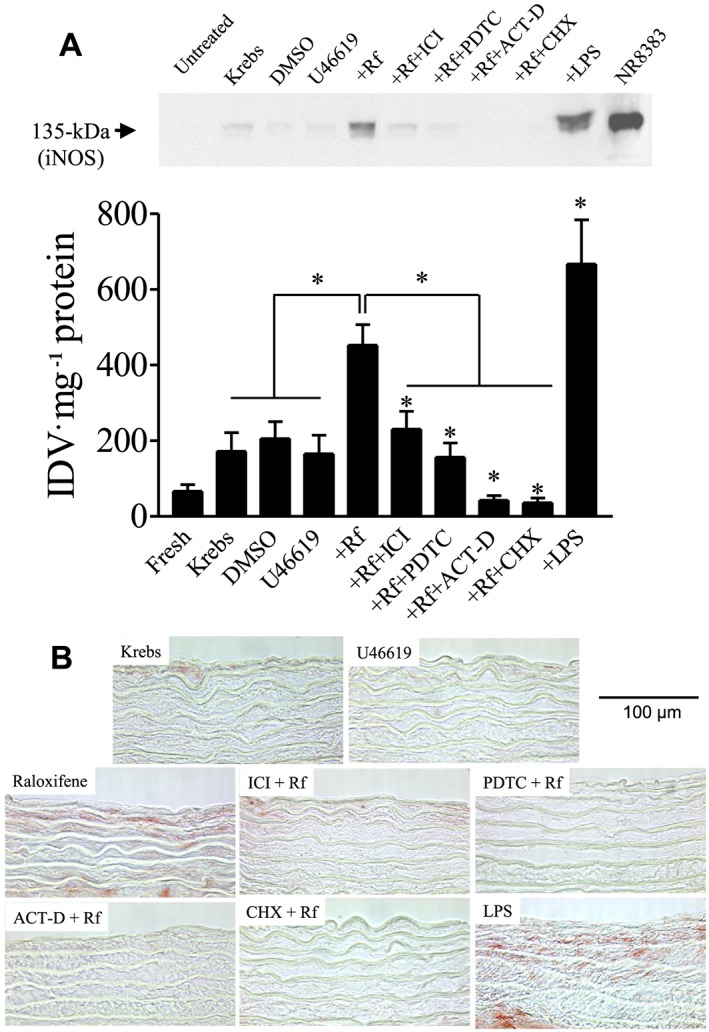
Figure 7.

(A) Effects of inhibitors on the increase in iNOS protein expression induced by 1 μM raloxifene after pre‐contracting with 20 nM U46619 in endothelium‐denuded rings. Representative western blot analysis (top panel). Densitometry analysis of results of western blots (bottom panel). Statistical differences are indicated between control and treatment groups, and between raloxifene (1 μM) and other treatment groups (*P < 0.05). Data are expressed as the value of integrated density value (IDV) mg‐1 protein. The results are means ± SEM of 6 to 12 experiments. The position of iNOS with 135 kDa was verified by molecular markers and LPS‐treated rat macrophage NR 8383 cell lysate. (B) Effects of inhibitors on the increase in iNOS protein expression induced by 1 μM raloxifene after pre‐contracting with 20 nM U46619 in endothelium‐denuded rings in vascular smooth muscle. Representative immunohistochemistry sections of endothelium‐denuded rings. Area stained with red colour (like raloxifene and LPS group) represents the location of iNOS induction. Original magnification: ×400. Scale bar: 100 μm. Figure is representative of at least three experiments performed on different experimental days.
