
Figure 1.
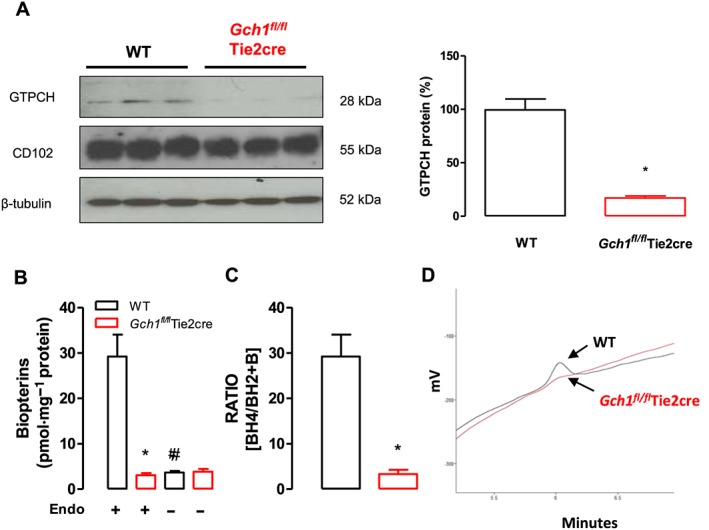
GTPCH and eNOS protein expression in mesenteric arteries. (A) Representative immunoblots showing GTPCH protein in wild‐type (WT) and Gch1 fl/flTie2cre mesenteric arteries, with quantitative data, measured as percentage band density, right and corresponding CD102 (endothelial cell marker) and β‐tubulin immunoblots, below. *P < 0.05; significantly different from WT; n = 6 animals per group. (B) Vascular BH4, measured by HPLC, was significantly reduced in mesenteric arteries from Gch1 fl/flTie2cre mice compared with WT littermates. Removal of endothelium in mesenteric arteries significantly reduced vascular BH4 levels in WT mice but unchanged in Gch1 fl/flTie2cre mice. *P < 0.05; significantly different from WT; #P < 0.05, significantly different from Endo+ ; n = 5 WT and six Gch1 fl/flTie2cre mice, only five WT matched littermates were available) (C) Ratio of BH4 to BH2 was significantly reduced in mesenteric arteries from Gch1 fl/flTie2cre mice compared with WT littermate controls. *P < 0.05; significantly different from WT; n = 5 WT and six Gch1 fl/flTie2cre mice, only five WT matched littermates were available). (D) Representative chromatograms of BH4 traces in mesenteric arteries from WT and Gch1 fl/flTie2cre mice.