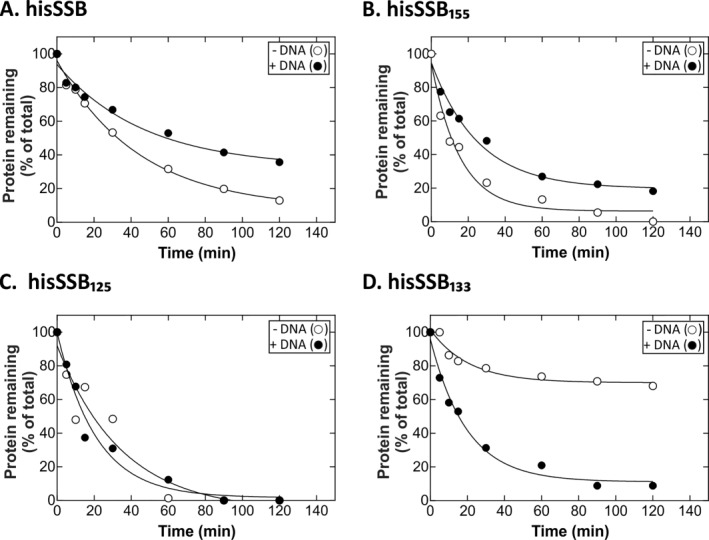
Figure 4.

The IDL affords enhanced protection in the presence of ssDNA. Analysis of gels presented in Figure 2. Coomassie stained gels were photographed and analyzed using ImageQuant 5.2. Graphs of substrate disappearance over time are shown. Data points were obtained by expressing amount of protein present in each lane as a fraction of t = 0. (A) hisSSB; (B) hisSSB155; (C) hisSSB125; (D) hisSSB133. The data in each graph were approximated by a single exponential producing the parameters in Table 2.
