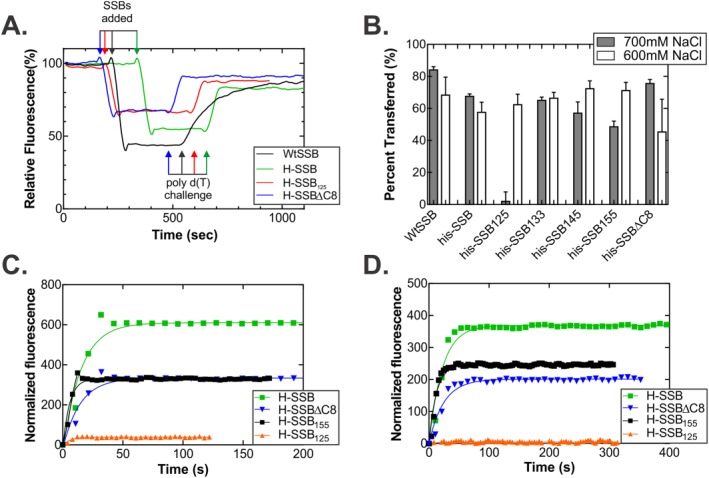
Figure 8.

The IDL is required for association with and dissociation from ssDNA. (A) Time course of the association/dissociation reaction. Four representative traces, normalized to the starting fluorescence signal of from the ATTO‐488 dye, are shown from reactions performed in 600 mM NaCl. For clarity, the raw data were smoothed using a 2nd order polynomial with 10 neighbors on each side. For each reaction, 50 nM 5′‐ATTO‐488(dT)65 oligonucleotide was pre‐incubated in reaction buffer for 4 min. Next, 50 nM SSB tetramer was added and once a stable, lower fluorescence signal was observed, poly d(T) was added to 15 μM nucleotides, final. (B) Analysis of the amount of each SSB protein that transfers from the oligo d(T)65 to the poly d(T). The %transferred = (ΔF 2/ΔF 1) * 100, where ΔF 1 is the magnitude of the change in fluorescence upon binding to oligo d(T)65, and ΔF 2 is the magnitude of the change in signal when the SSB transfers from the 65mer to the poly d(T). For each protein, two separate assays were done at each concentration of NaCl. (C and D) Representative time courses done in 700 mM NaCl. In C, the forward reaction or binding to the 5′‐ATTO‐488‐d(T)65 oligonucleotide is shown, and in D, the transfer reaction is shown. Each curve represents the average fluorescence signal from two separate reactions for each protein. The signal is normalized to the starting fluorescence signal for each stage of each reaction.
