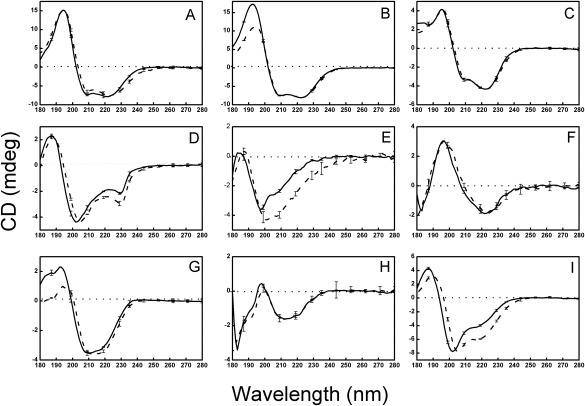
Figure 1.

CD Spectra of Globular Soluble Proteins. CD spectra of soluble globular proteins representing the four CATH classes (mostly helical: panels A, B, and C; mostly sheet: panels D, E, and F; mixed helix/sheet: panels G and H; and irregular: panel I). Solid lines represent solution spectra, while dashed lines are from films. The error bars indicate one standard deviation in three repeated measurements. The proteins are A: hemoglobin, B: myoglobin, C: cytochrome C, D: α‐chymotrypsin, E: elastase, F: concanavalin A, G: ribonuclease A, H: carbonic anhydrase II, I: aprotinin.
