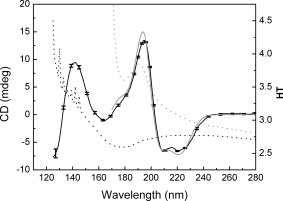
Figure 2.

SRCD and HT Spectra of Hemoglobin in Solution and Films. These spectra demonstrate that the film samples have little or no water remaining, due to the lack of a peak in the HT spectrum (dotted black line) around 170 nm. This lack of water also enables the film SRCD spectrum (solid black line) to be measured to shorter wavelengths (∼125 nm). The series of sharp peaks in the HT spectrum below ∼140 nm are due to absorbance of the nitrogen gas flushing the sample chamber. By comparison, the HT spectrum of the solution (dotted grey line) exceeds the maximum cutoff value of 5.0 at all wavelengths below 172 nm due to edge of the large water absorption band, which limits the lowest wavelength measurable in the SRCD spectrum (solid grey line) to ∼170 nm.
