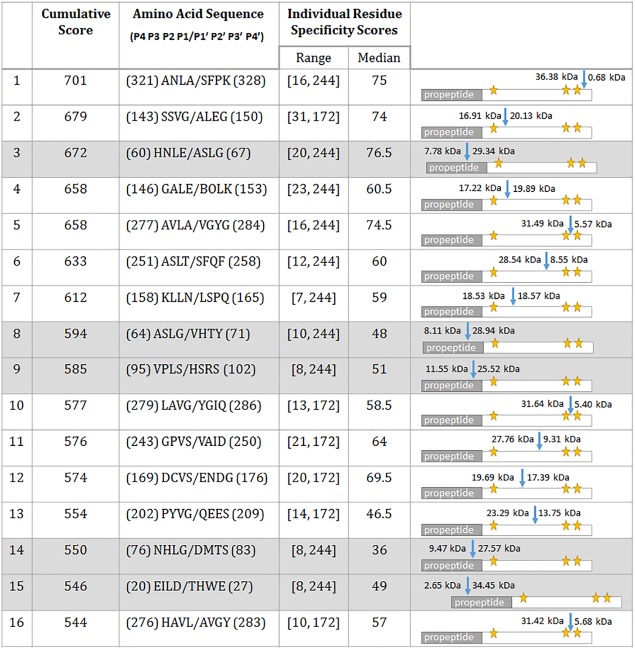
Figure 2.

Top 5% of cumulative cleavage scores of cathepsin S cannibalizing cathepsin K. The table includes the highest‐scored regions of where cleavage of cathepsin K by cathepsin S is most likely to occur as well as descriptive information about the range and median residue scores and a schematic of where cleavage was expected to occur within the cathepsin K protein. The pro‐region of cathepsin K includes residues 1 to 114, which were excluded when determining cathepsin K mutants to interrupt cathepsin cannibalism. The ‘/’ in the amino acid sequences indicates the scissile bond that would be hydrolyzed by cathepsin S. Schematics in the right column have a blue arrow indicating the hydrolysis would occur along with subsequence fragment sizes. Yellow stars indicate the active site residues for cathepsin K.
