
Figure 8.
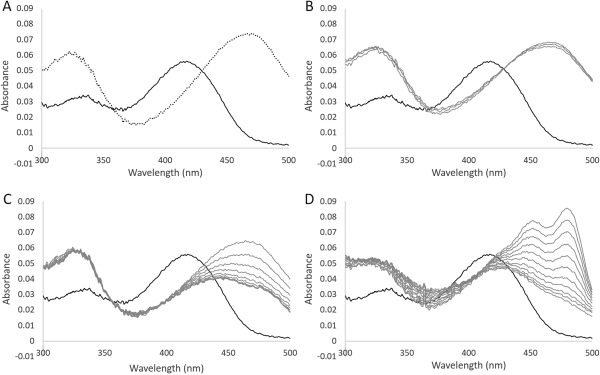
Absorption spectrum of the A70S variant of the L. plantarum CBS. A: Absorption spectrum of solutions containing 10 μM A70S variant in the absence (solid line) or in the presence of 1 mM l‐OAS (dotted line). B, C: Changes in the spectrum after addition of 1 or 10 mM l‐cysteine to a solution containing the A70S variant, respectively. D: Changes in the spectrum after addition of 1 mM lanthionine to a solution containing the A70S variant. The bold line represents the spectrum before the addition of l‐cysteine or lanthionine. The spectrum was recorded every 3 min.