
Figure 7.
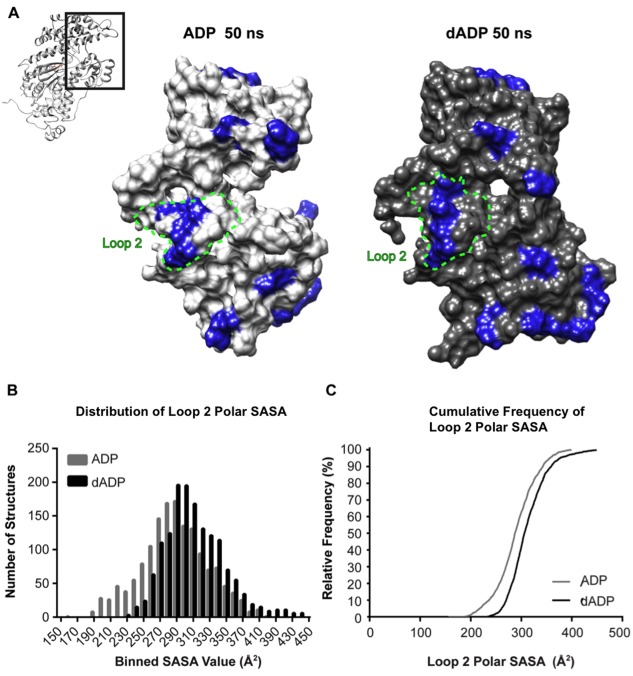
Assessment of dADP.Pi‐induced alteractions to actin binding surface. (A) Representative actin binding surface structures at 50 ns from ADP.Pi and dADP.Pi simulations. For reference, the entire S1 region is shown in context in the ribbon figure and the region in the boxed region is blown up in the surface rendering. Blue highlight indicates positively charged residues. These residues are more exposed to the solvent in the dADP.Pi simulations. (B) Histograms including structures from all six simulations (three ADP.Pi, three dADP.Pi) at 100 ps granularity (1503 structures in each group) highlight the right shift of the distribution of Loop 2 polar SASA values in dADP.Pi simulations. (C) This effect is further evidenced by the cumulative frequency plot that demonstrates at any SASA value observed, there is a higher fraction of dADP.Pi structures that have higher SASA values than ADP.Pi structures.