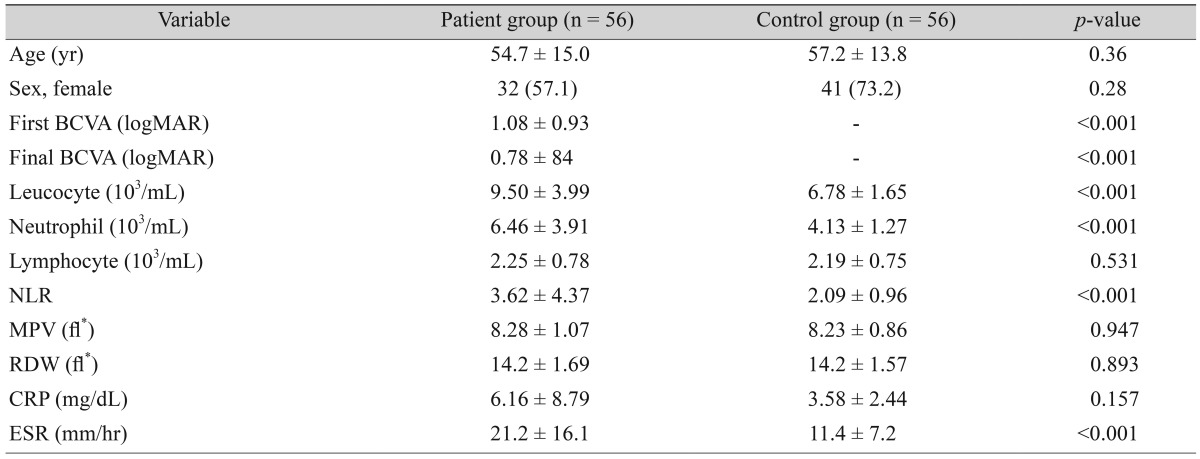
Table 1. Demographic data, clinical characteristics, and blood parameters of the study groups.
Values are presented as mean ± standard deviation or number (%).
BCVA = best-corrected visual acuity; logMAR = logarithm of the minimum angle of resolution; NLR = neutrophil to lymphocyte ratio; MPV = mean platelet volume; RDW = red blood cell distribution width; CRP = C-reactive protein; ESR = erythrocyte sedimentation rate.
*fl = (plateletcrit [%] / platelet count [×109/l]) × 105.

