
Fig. 1.
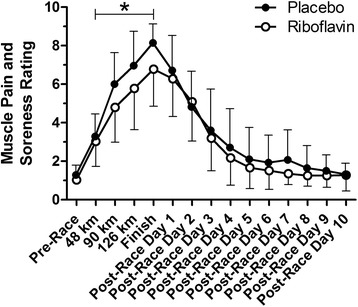
Mean lower-body muscle pain and soreness ratings for the 2 groups. *p = .043 for group comparison considering only the during-race and finish data. Error bars represent 1 SD and are shown only in 1 direction for clarity
Official websites use .gov
A
.gov website belongs to an official
government organization in the United States.
Secure .gov websites use HTTPS
A lock (
) or https:// means you've safely
connected to the .gov website. Share sensitive
information only on official, secure websites.
Mean lower-body muscle pain and soreness ratings for the 2 groups. *p = .043 for group comparison considering only the during-race and finish data. Error bars represent 1 SD and are shown only in 1 direction for clarity