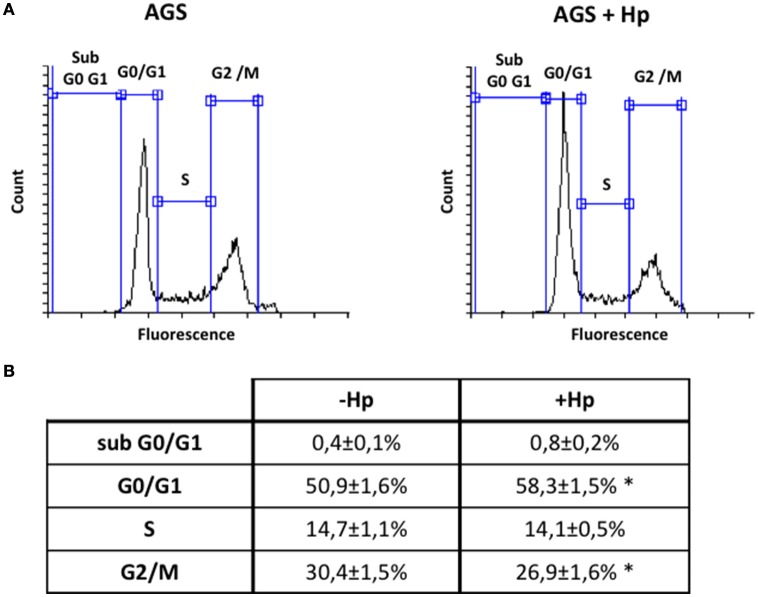
Figure 6.
H. pylori infection increases cells in G0/G1 phase and decreases cells in G2/M phase of cell cycle. AGS cells were infected with H. pylori 26695 at MOI 100 for 24 h and cell cycle distribution was determined by flow cytometry. (A) Representative profiles of the cell cycle distribution are shown for the indicated conditions. (B) Percentage of cells in each phase of the cell cycle phase are summarized (mean ± SEM, n = 4; *p < 0.05).

