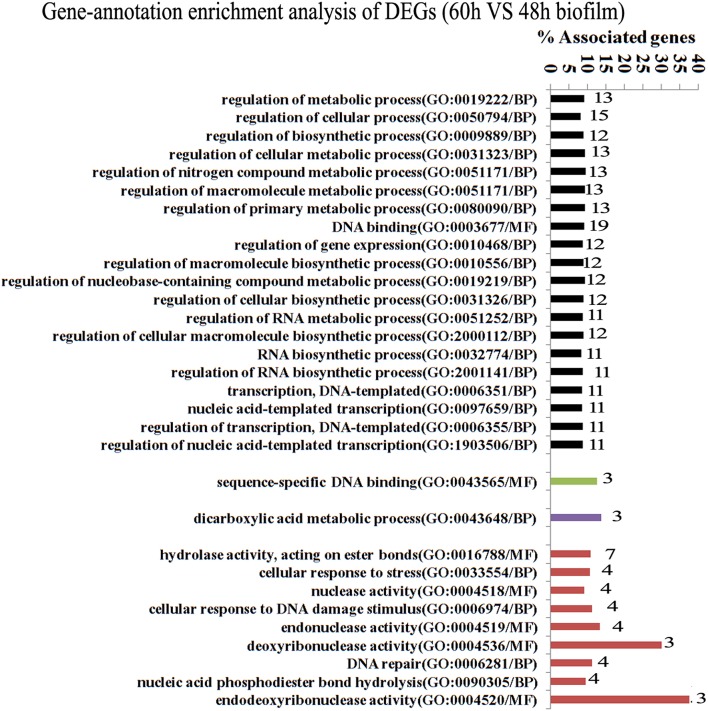
Figure 3.
Transcriptome analysis of S. mutans biofilm during dispersion (60 vs. 48 h). Four protein interaction networks represented by different colors were identified among 137 DEGs. The genes in each network were clustered into functional annotation terms. The DEGs in GO term deoxyribonuclease activity and endodeoxyribonuclease activity reached 30 and 37.5%. GO, gene ontology; BP, biological process; MF, molecular function.

