Figure 6.
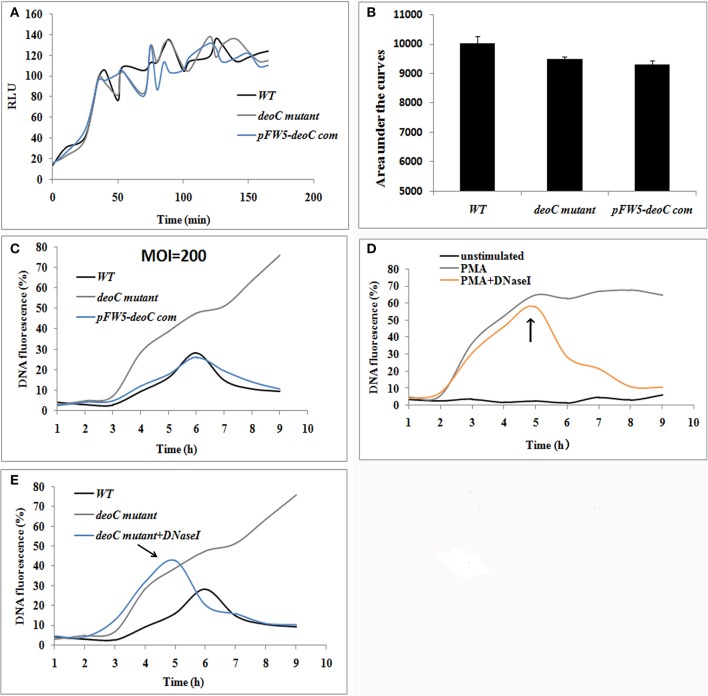
S. mutans-stimulated NET formation of neutrophils. (A,B) ROS production of human neutrophils by a luminometric assay. ROS production reached a maximum at approximately 2 h (MOI = 200) in all the tested strains, indicative that S. mutans was recognized by human neutrophils and had the potential to induce NET formation (A). No significant difference was observed in the ROS levels between the wild type (WT) and deoC mutant represented by the areas under the curve (B), indicating that the neutrophil activation potential of S. mutans was independent of DeoC. RLU, Relative light units. (C) DNA release of neutrophils co-cultured with S. mutans strains. (D) DNA release of neutrophils stimulated with PMA. DNA release was quantified by the live cell impermeant fluorescent DNA dye SytoxGreen. Data are shown as percentages of DNA fluorescence compared with a TritonX-100 lysis control (100%). (E) DNaseI degraded the released DNA of neutrophils induced by deoC mutant. DNaseI was added after 5 h of co-culture. The arrows indicated the addition of DNaseI at 5 h.

