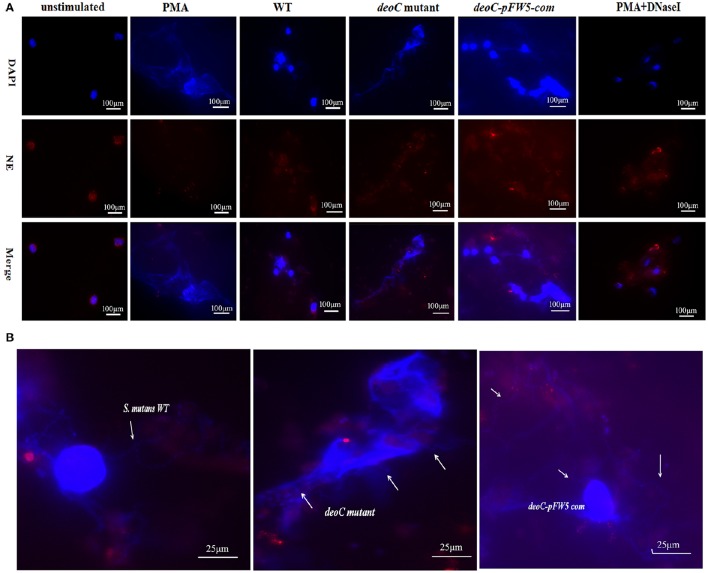
Figure 7.
Visualization of NET formation and degradation. (A) Neutrophils were stimulated for 4 h either with PMA, S. mutans wild type (WT), deoC mutant, or pFW5-deoC com (MOI 200), or were left unstimulated. (B) Enlarged immunofluorescent micrographs of NE (HRP conjugated, red), DNA (DAPI, blue), and S. mutans WT, deoC mutant, and pFW5-deoCcom strains; the arrows indicate the S. mutans cells.

