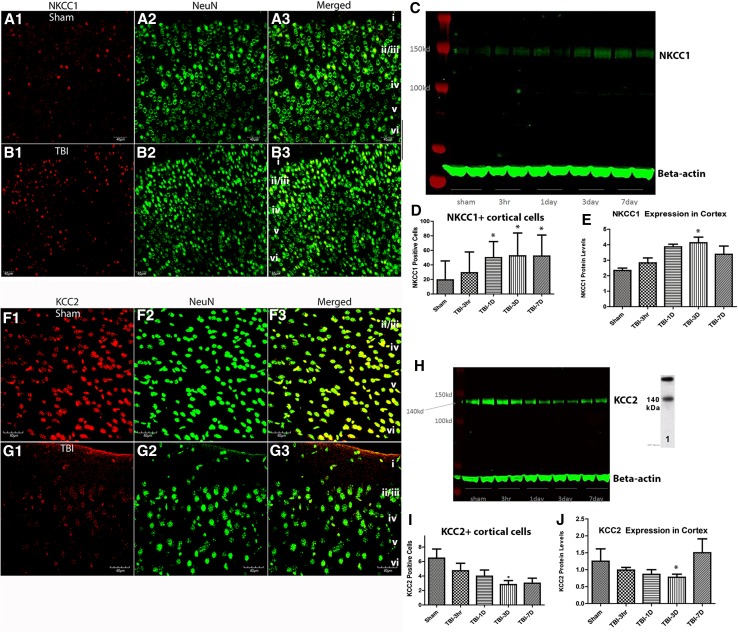
Fig. 1.
Increased NKCC1 and decreased KCC2 after TBI. a, b Immunohistochemical staining of NKCC1 (a1, b1), NeuN (a2, b2), and the merged image (a3, b3) are illustrated to show neuronal NKCC1 in layers i–vi of cortex, at 3 days following sham (a1–a3) and TBI (b1–b3) mice. In c, an example of a western blot assessing NKCC1 in sham and TBI mice at 3 h, 1, 3, and 7 days post-FPI. Quantitative analysis of NeuN+/NKCC1+ cells (d) revealed a significant increase after by 1 day post-TBI and persisting until at least 7 days after TBI. The counts represent number of NKCC1+/NeuN+ cells per 25,000 µm2. Consistent with this finding, western blot analysis (e) of NKCC1 in cortical tissue revealed a significant increase (F (4,15) = 4.868, P < 0.05, one-way ANOVA) at 3 days post-TBI. It is pertinent to note that we also present qPCR analysis in both cortex and hippocampus, and immunohistochemistry in cortex, showing that the elevation of NKCC1 is bilateral (see Supplementary Figs. 1 and 2). In f–g, KCC2 and NeuN double-labeling is shown to depict a decrease in KCC2 following TBI (g1–g3) compared with shams (f1–f3). h Western blot assessing KCC2 in sham and TBI mice at 3 h, 1, 3, and 7 days post-FPI. Quantitative analysis of the NeuN+/KCC2+ cells (i) demonstrated that a significant decrease by 3 days after TBI. The counts represent number of KCC2+/NeuN+ cells per 25,000 µm2 of primary motor and somatosensory cortex. Western blot analysis (j) revealed that protein levels of KCC2 were significantly decreased (F (4,15) = 1.716, P < 0.05) in cortex by 3 days after TBI

