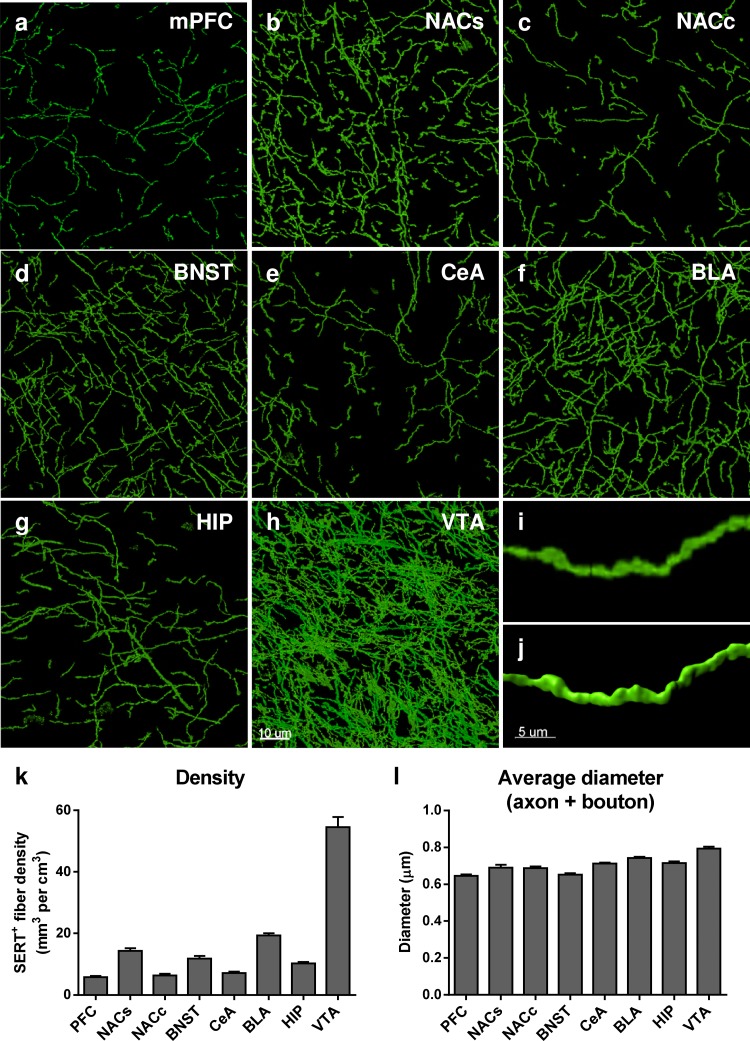
Fig. 2.
Distribution of SERT immunoreactive serotonergic axons throughout the limbic brain regions. a–h Representative 60x micrographs of SERT+ axons in the mPFC (a), NACs (b), NACc (c), BNST (d), CeA (e), BLA (f), HIP (g) and VTA (h). The micrographs correspond to the maximum intensity projection of 50 z-stacks across a 15-μm z-depth. i Higher magnification of a SERT immunoreactive axon in the BLA, and j shows the corresponding 3D reconstruction using Imaris software. k Quantification of the density of SERT immunoreactive fibers throughout the limbic brain. The results, expressed in mm3 of fibers per cm3 of tissue, are represented as the mean ± SEM of n = 30 images/brain region. l Extrapolated average diameter of SERT-immunoreactive fibers in each brain region (see ‘‘Material and methods’’). The results are expressed in μm and represented as the mean ± SEM of n = 30 images/brain region. Scale bars, a–h 10 μm; i–j 5 μm

