Fig. 3.
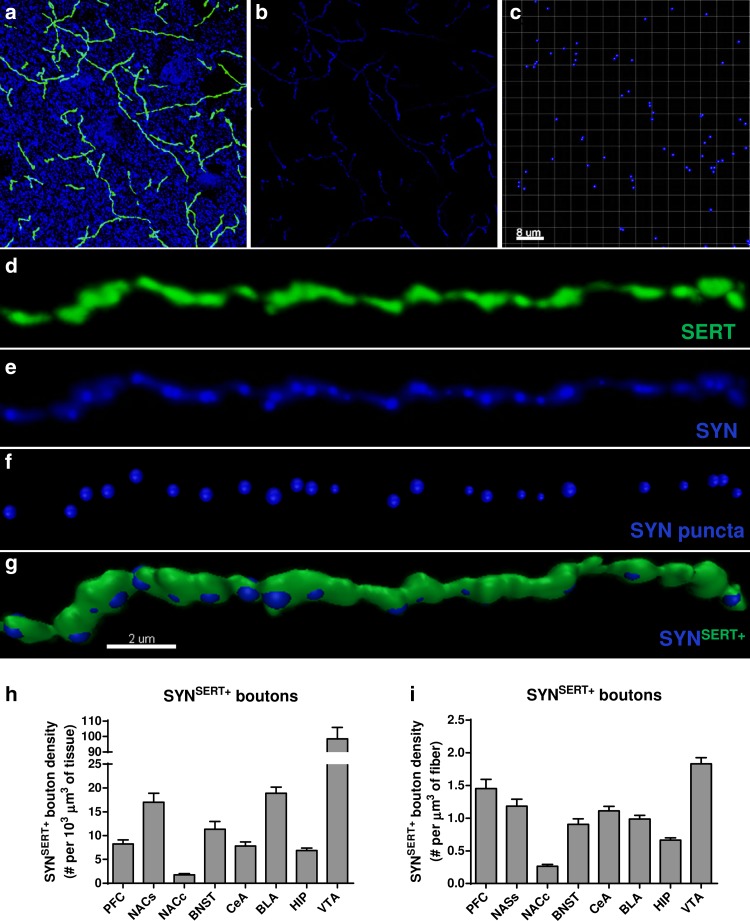
Identification and quantification of SYNSERT+ boutons within limbic brain areas. a Micrograph representing double immunostaining of SERT positive fibers (green) and the presynaptic marker synaptophysin (blue) in the mPFC. b Use of the masking function of Imaris software to mask the synaptophysin labeling located outside the SERT immunoreactive fibers. c Use of the spot detection function of Imaris software to identify the synaptophysin puncta with a minimum diameter of 0.4 μm. d–g Example of a 3D reconstruction of the synaptophysin immunoreactive boutons in SERT labeled fibers in the mPFC with Imaris software. d SERT-immunolabeled axon (green), e synaptophysin immunolabeling (blue) inside SER- immunolabeled fibers, f spot detection of synaptophysin puncta (blue) inside SERT-immunolabeled fibers, g 3D reconstruction of SERT-immunoreactive axons and the detected synoptophysin-positive boutons SYNSERT+. h–i volumetric quantification of the density of synaptophysin immunoreactive boutons within SERT-labeled fibers (SYNSERT+). The results are expressed in number of boutons per 103 μm3 of tissue (e) or per μm3 of SERT-immunoreactive fibers (f) and represented as the mean ± SEM of n = 30 images/brain region. Scale bars, a–c 8 μm; d–g 2 μm

