Fig. 7.
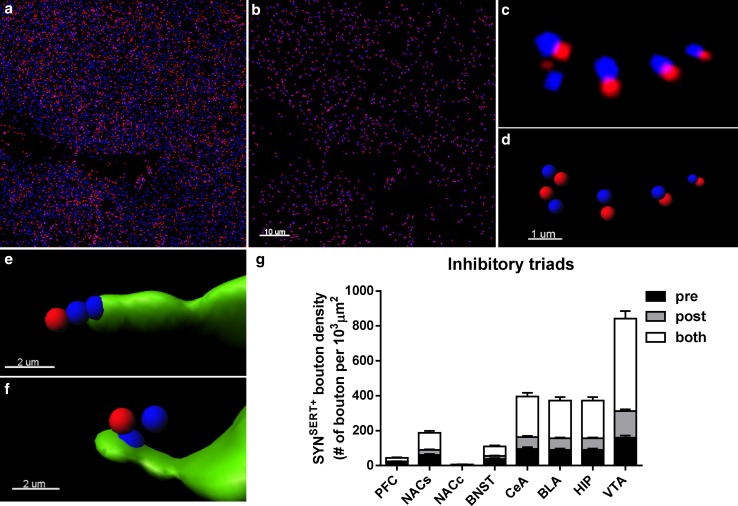
3D-reconstruction and quantification of inhibitory 5-HTergic triads throughout the limbic brain. a Micrograph representing a double immunostaining of the presynaptic marker synaptophysin (blue) and the inhibitory postsynaptic marker gephyrin (red) in the BLA. b Use of the spot colocalization function in Imaris to identify the synaptophysin (blue) and gephyrin (red) spot pairs in the vicinity of 0.6 μm, which defined neurochemical inhibitory synapses. c Higher magnification image of synaptophysin (blue) and gephyrin (red) spot pairs. d Use of the spot detection function of Imaris software to reconstruct the neurochemical inhibitory synapses in 3D. e 3D reconstruction of SYNSERT+ boutons within SERT+ fibers (green) apposed to within 0.6 μm presynaptic specialization of a neurochemical inhibitory synapse (blue). f 3D reconstruction of SYNSERT+ boutons in SERT+ fibers (green) orientated toward the postsynaptic specialization of a neurochemical inhibitory synapse (red). g Quantification of the density of putative inhibitory triads. The results are expressed as the number of putative synapses per 103 μm3 of SERT+ fiber. The density of SYNSERT+ boutons preferentially orientated toward the presynaptic (black), postsynaptic (dark gray) or equidistant from both specializations (light gray) are represented as the mean ± SEM of n = 30 images/brain region. Scale bars, a, b 10 μm; c, d 1 μm; e, f 2 μm

