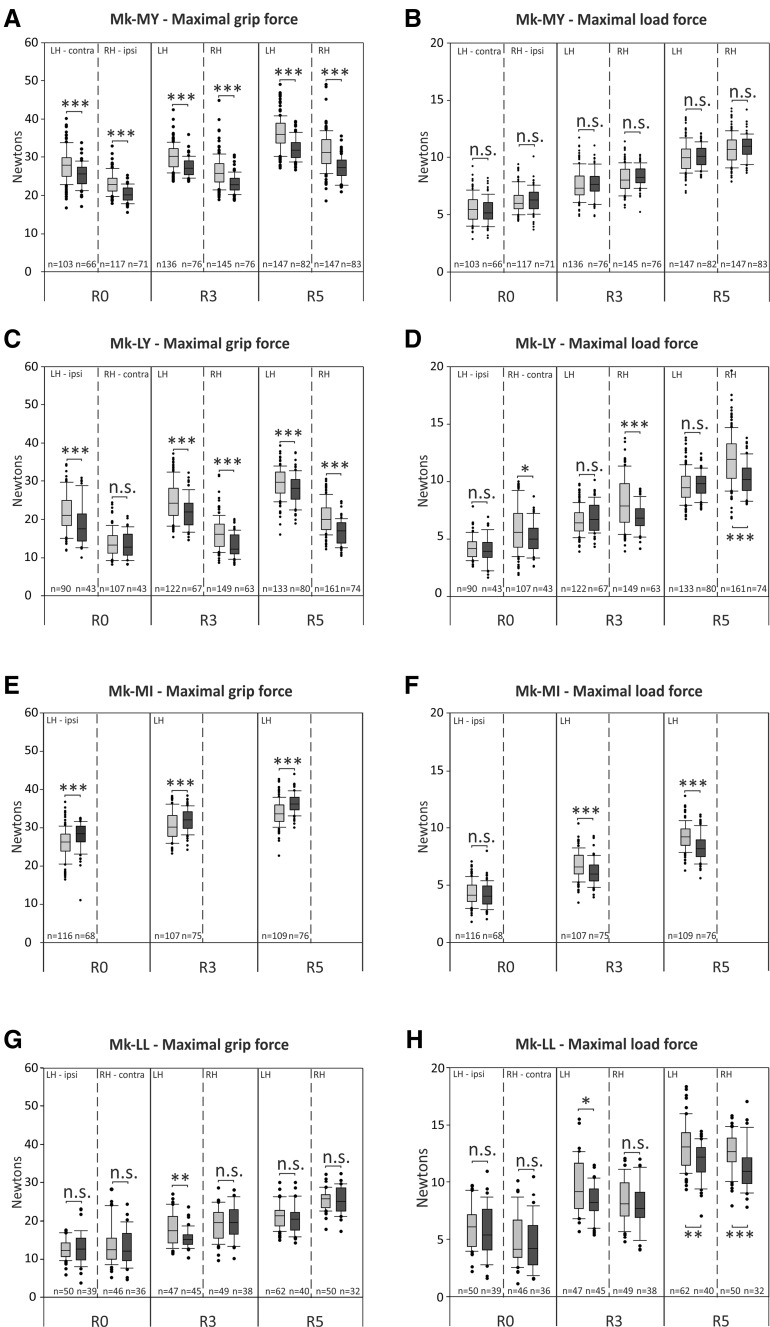
Fig. 3.
Box and whiskers graphs show the quantitative assessments in the “reach and grasp drawer” task, separately for the three resistances, namely, R0, R3, and R5. For each resistance, the left hand (LH) and the right hand (RH) are represented. Box plots are composed of all correct trials before (pre-, represented in gray) and after (post-, represented in black) the cortical biopsies. The total number of correct trials included in each box and whiskers is indicated at the bottom of each column (n =). Statistical analyses (parametric Student unpaired t test/Mann–Whitney test) compare maximal grip and load forces between pre-biopsy and post-biopsy sessions, for each resistance and for each hand. Statistically significant differences are indicated: * is for p ≤ 0.05, ** for p ≤ 0.01, *** for p ≤ 0.001, « n.s. » meaning statistically non-significant (p > 0.05). a, b show the maximal grip force and maximal load force for Mk-MY, in which the right hand is the ipsilesional hand. c, d show the maximal grip force and maximal load force for Mk-LY, in which the right hand is the contralesional hand. e, f show the maximal grip force and maximal load force for Mk-MI, in which the left hand is the ipsilesional hand. For Mk-MI only the left hand was analyzed (not able to perform precision grip with the right hand). g, h show the maximal grip force and maximal load force for Mk-LL, in which the right hand is the contralesional hand

