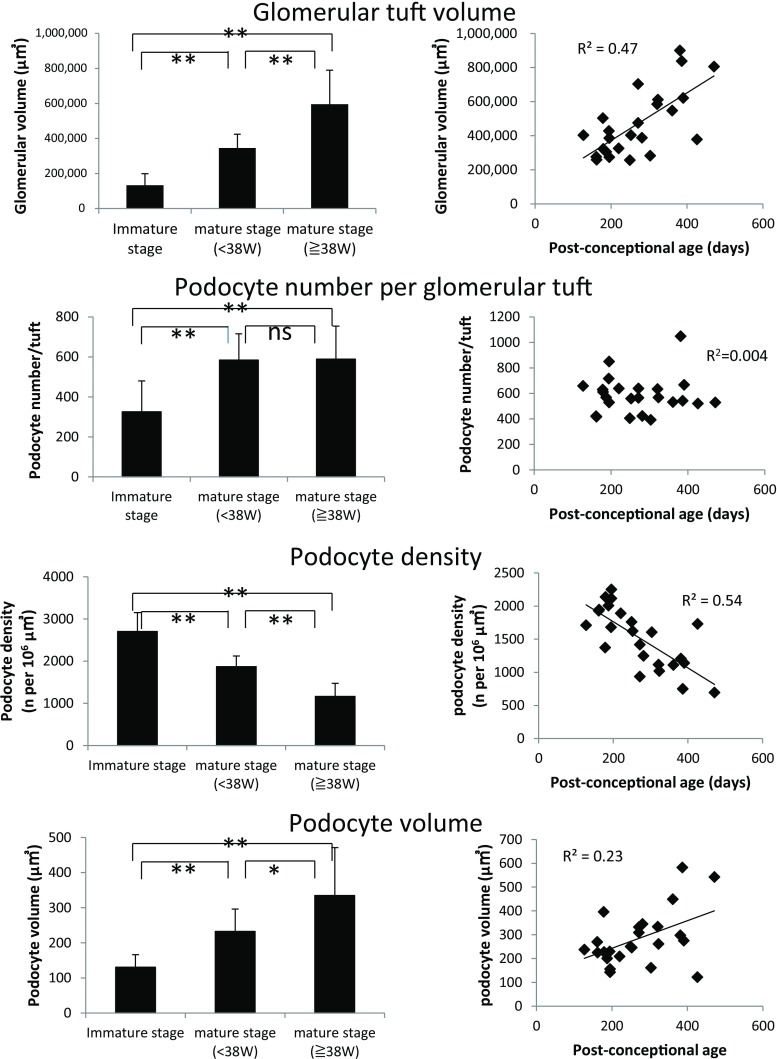
Fig. 4.
Changes in podometric parameters occurring with glomerular development and post-conceptional age. Left panels show a comparison of three stages of glomerular development including immature development, mature <38 weeks’ gestation stage and mature ≥38 weeks’ gestation stages. The right panels show individual data points for all mature stage glomeruli in relation to post-conceptional age. These data emphasize how glomerular volume increases as post-conceptional age increases and as glomerular development proceeds. In contrast, podocyte number increases from the immature stage to the capillary loop stage to reach a maximum averaging about 600 podocytes per tuft, but does not increase thereafter in association with continuing glomerular enlargement. Podocyte density, therefore, decreases with development and post-conceptional age requiring podocyte size to increase 1.8-fold between immature and mature (<38 weeks) and 2.6-fold by mature (≥38 weeks’ gestation). Values are mean ± SD. *p<0.05, **p < 0.01

