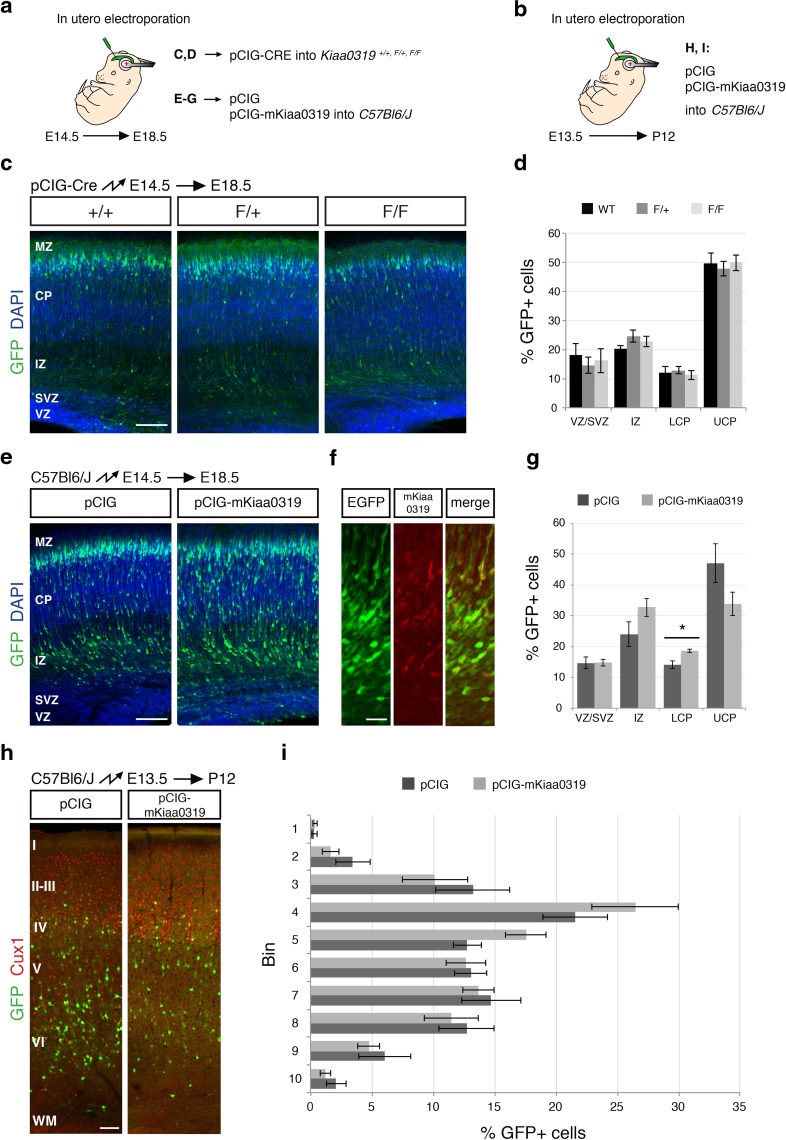
Fig. 4.
Effects on radial migration upon Kiaa0319 depletion or overexpression. a Illustration of the strategy to study the effects of altered Kiaa0319 levels on neuronal migration at embryonic stages. To reduce KIAA0319 levels, embryos from wild-type (+/+), heterozygous (F/+), and homozygous (F/F) floxed animals were electroporated in utero at E14.5 with pCIG-Cre. For overexpression, C57Bl/6J embryos were electroporated at E14.5 with either pCIG or pCIG-mKiaa0319. Neuronal position was analysed at E18.5. b Strategy to assess the effect of Kiaa0319 overexpression on migration at postnatal stages. C57Bl/6J embryos were electroporated at E13.5 with either pCIG or pCIG-mKiaa0319 and analysed at postnatal day 12. c Representative images of coronal sections of embryos electroporated with pCIG-Cre. Electroporated neurons are shown in green and nuclei (DAPI stained) in blue. KIAA0319 depletion at E14.5 does not alter the radial migration of cortical projection neurons. d Quantification of the percentage of electroporated neurons in the VZ/SVZ, IZ, LCP, and UCP shown in c. Neurons were counted in three slices of 7 (F/F), 8 (F/+) or 5 (+/+) electroporated brains originating from three separate experiments. The data represent mean ± SEM. No statistically significant differences were found by one-way ANOVA analysis. e Representative images of coronal sections of embryos electroporated with pCIG or pCIG-mKiaa0319. Electroporated neurons are shown in green and nuclei (DAPI stained) in blue. Kiaa0319 overexpression slightly impairs migration. f Immunohistochemistry to detect the overexpressed KIAA0319 protein. Neurons electroporated with pCIG-mKiaa0319 express EGFP (green) and stain with anti-KIAA0319 R5 antibody (red). g Quantification of the percentage of electroporated neurons in the VZ/SVZ, IZ, LCP, and UCP shown in e. The data represent mean ± SEM. *p < 0.05 by Student’s t test. Three slices from five brains coming from three separate electroporations were counted for each condition. h Representative images of coronal sections of embryos electroporated at E13.5 with pCIG or pCIG-mKiaa0319 and analysed at P13. Electroporated neurons are shown in green. Cux1 staining to label upper cortical layers is shown in red. No difference in the distribution of targeted neurons is apparent. i Quantification of the distribution of electroporated neurons shown in h. The data represent mean ± SEM. No statistically significant differences were found for any of the bins by Student’s t test. Three slices from four brains coming from three separate electroporations were counted for each condition. MZ marginal zone, LCP lower half of the cortical plate, UCP upper half of the cortical plate, other abbreviations as in Figs. 2, 3. Scale bars 100 μm

