Figure 3.
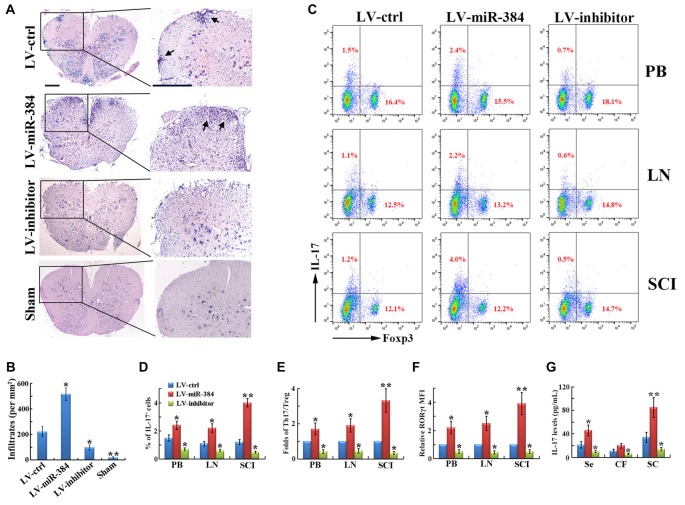
MiR-384 disrupts the Th17/Treg ratio during EAE. (A) Representative hematoxylin and eosin (H&E) staining of spinal cord sections from LV-transfected and sham control mice. Boxed areas in left images are enlarged in right images. Arrows show lymphocyte infiltration. Scale bars, 50 μm. (B) Quantification of spinal cord infiltrates in (A). (C) Representative flow cytometric analyses of IL-17+ and Foxp3+ cells among CD4+ gated cells from stimulated PB, LN and spinal cord infiltrating (SCI) lymphocytes. (D,E) Statistical analyses of the percentage of IL-17+ cells and the ratio between IL-17+ Th17 and Foxp3+ Treg cells in (B; n = 3 per group). (F) MFI analyses of flow cytometry for RORγt (n = 3 per group). (G) The concentration of IL-17 in serum, cerebrospinal fluid and spinal cord homogenate was measured by ELISA (n = 5 per group). Data are presented as means ± SD. *p < 0.05 and **p < 0.01. Data shown are single representative results from three independent experiments.

