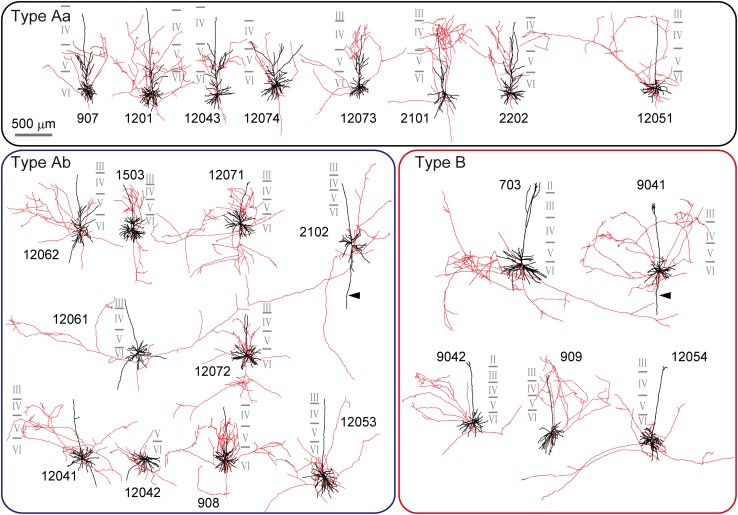
Fig. 2.
Reconstructions of L6 spiny cells (N = 23). Cells are divided into three types, according to the cluster analysis shown in Fig. 1e: Type Aa (top), Type Ab (lower left) and Type B (lower right). See also main text. Reconstructions are rotated around the pia–white matter axis in order to show horizontal extent of their axons. Dendrites and somata are shown in black, axons in red. Solid gray lines close to each cell represent laminar borders which are numbered. Scale bar 500 μm

