Fig. 5.
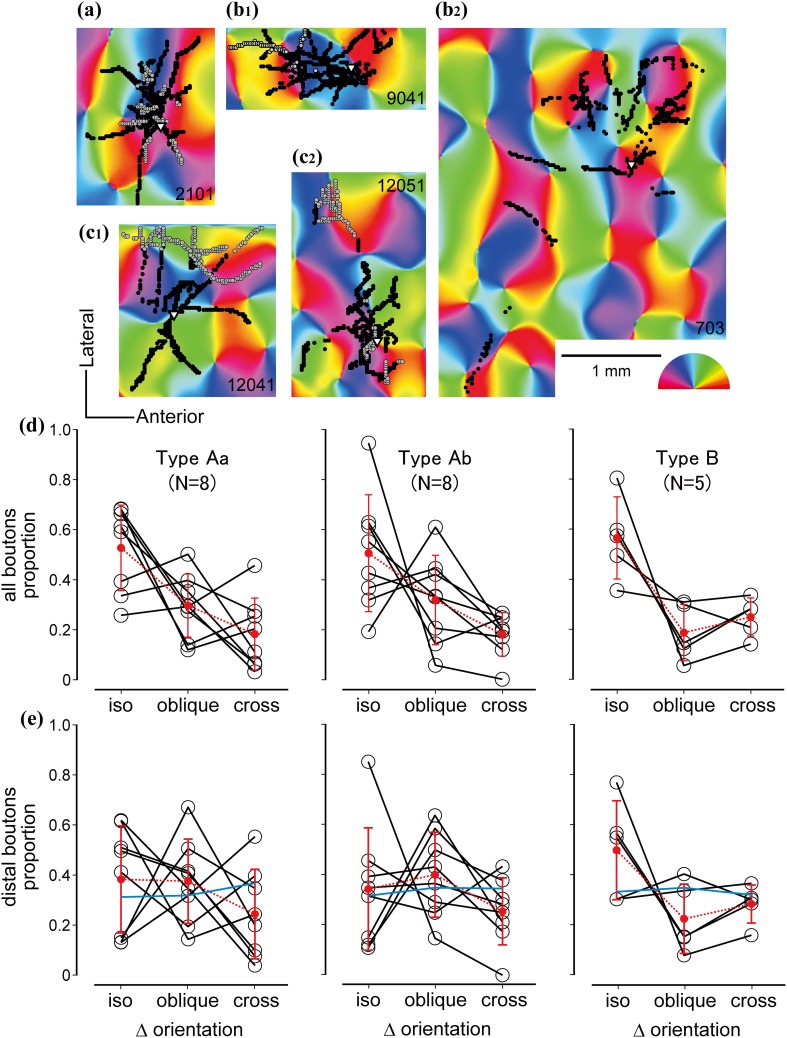
Distribution of boutons of L6 spiny neuron types to orientation map. Black dots represent lower tier boutons, black edged gray dots upper tier boutons. Triangle shows soma position. a Type Aa cell located near to a rapidly changing orientation zone. b 1 Type B cell located in an orientation domain representing nearly vertical orientations. Most boutons occupy similar orientations to that of the parent soma. b 2 Another Type B cell, whose axons extended widely showing chiefly iso-orientation preference. c 1 Type Ab cell projecting to a broad range of orientations. c 2 Type Aa cell with boutons preferring similar orientations. Scale bar 1 mm. Preferred orientation is indicated by color code. d Orientation preference of boutons for all 21 spiny cells examined. Difference of preferred orientation between soma pixel and bouton pixel was calculated (∆orientation) and binned into iso (<30°), oblique (30°–60°), and cross-(>60°) orientations. Each black line represents a single cell. Red line represents the mean, error bars indicate SD. e The same analysis as shown in d was applied to distal boutons alone defined as >250 μm away from the parent soma. Note that iso-orientation preference is strongest for Type B. Blue line indicates the mean orientation distribution of all pixels within the area of distal axons (see “Materials and methods”). Importantly, pixel distributions showed an almost equal representation in all orientation categories indicating the absence of a “forced choice” situation

