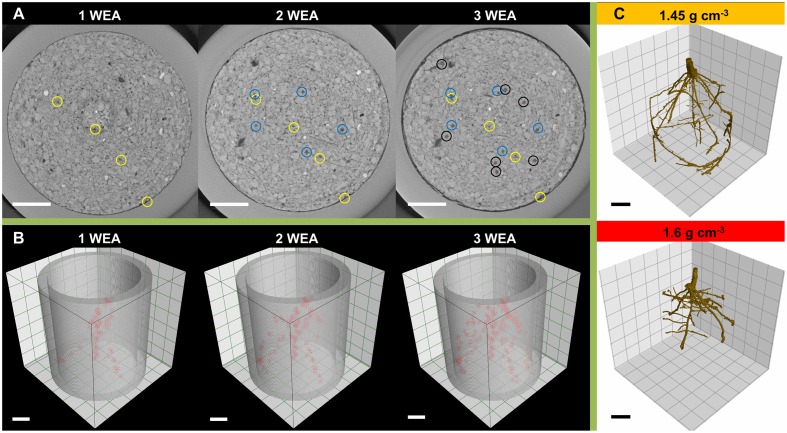
FIGURE 1.
Illustration of root system quantification by means of X-ray computed tomography: (A) cross sections taken 1 cm below seed base 1, 2, and 3 weeks after shoot emergence (WAE) with axial roots marked (circles); (B) three dimensional arrangement of lateral branching points (red markers) within the top 6 cm of the soil column 1, 2, and 3 WAE; (C) segmentation of root system 2 WAE under moderate (1.45 g cm-3) and high soil bulk density (1.6 g cm-3); Scale bar = 1 cm.

