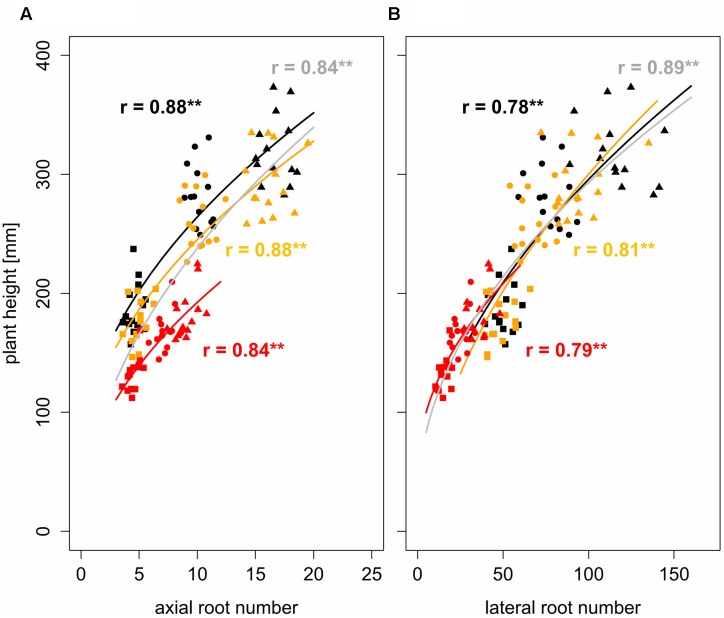
FIGURE 2.
Non-linear regressions and Pearson correlation coefficients between (A) axial and (B) lateral root number and plant height under bulk densities of 1.3 g cm-3 (black), 1.45 g cm-3 (orange), and 1.6 g cm-3 (red), gray represents regression over all three bulk densities; square, circle, and triangle symbol shapes represent values obtained 1, 2, and 3 weeks after leaf emergence, respectively; ∗∗ denotes significant correlation at p < 0.01 (n = 4).

