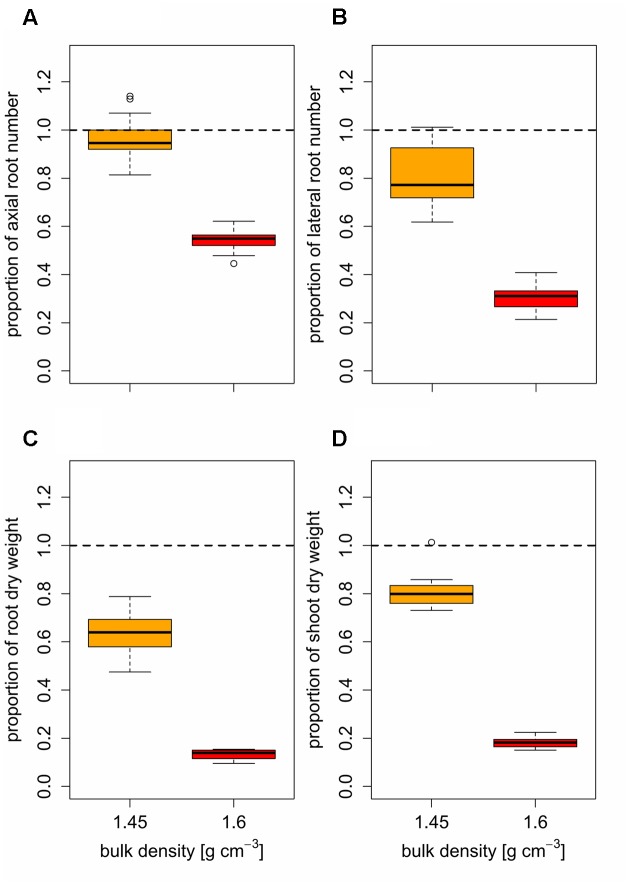
FIGURE 5.
Boxplots of relative (A) axial and (B) lateral root numbers, (C) root and (D) shoot dry weight based on mean values (n = 4) of 14 genotypes under moderate (1.45 g cm-3, orange) and high bulk density (1.6 g cm-3, red), expressed as the ratio between genotype mean values under increased and low (1.3 g cm-3) bulk density; dashed line represents low bulk density.

