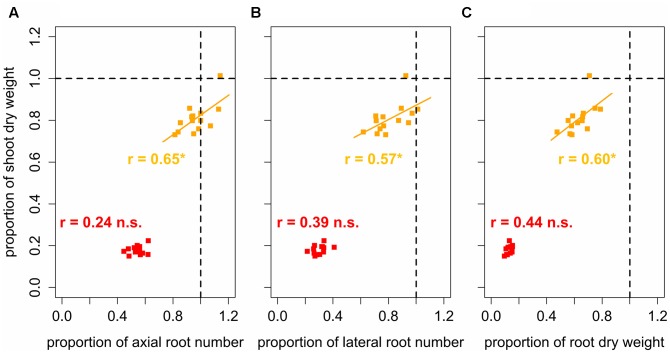
FIGURE 6.
Linear regressions and Pearson correlation coefficients between relative shoot dry weight and relative (A) axial and (B) lateral root number and (C) relative root dry weight, expressed as the ratio between genotype mean values under increased (1.45 g cm-3, orange; 1.6 g cm-3, red) and low (1.3 g cm-3) bulk density represented by dashed lines; ∗ denotes significant correlation at p < 0.05, n.s., denotes non-significant correlations (n = 4).

