FIGURE 4.

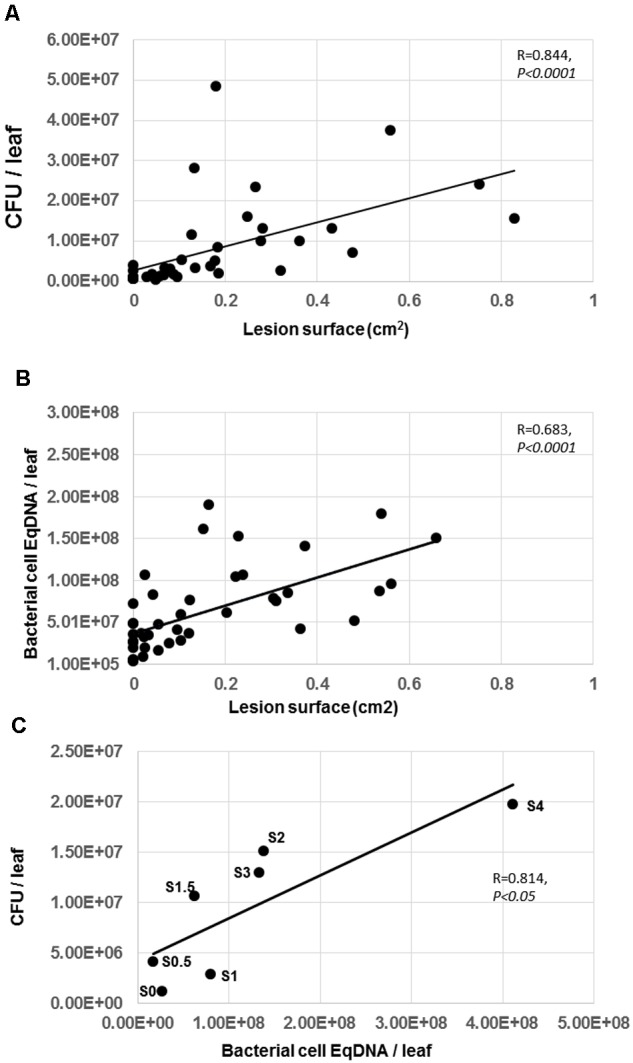
Correlation between lesion surface and bacterial population estimated by CFU or DNA in Arabidopsis leaves. (A) Bacterial population estimated by CFU was plotted against LS. (B) Bacterial population estimated by qPCR was plotted against LS. (C) Bacterial population estimated by qPCR was plotted against bacterial populations estimated by CFU in each class of symptoms (S0 = Stage 0, S0.5 = Stage 0.5, etc). Experiment was repeated twice with similar results. Representative data are shown. Determined coefficients are indicated (Spearman for A and B, Pearson for C).
