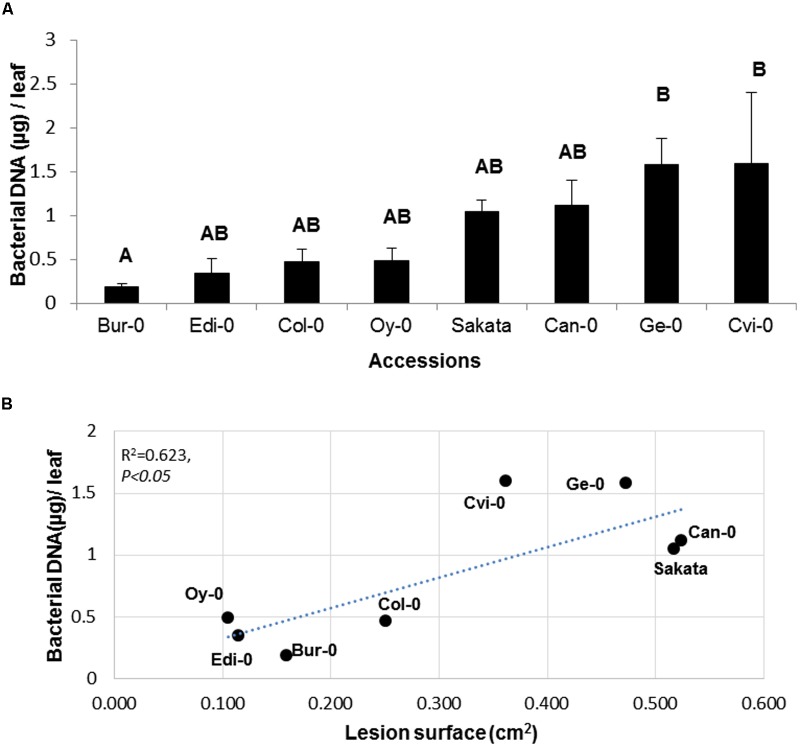
FIGURE 5.
Quantification of disease and bacterial populations on a collection of Arabidopsis accessions. (A) Bacterial population estimated by qPCR on the indicated Arabidopsis genotypes 48 h p.i. (B) Bacterial population estimated by qPCR was plotted against LS for each genotype. Experiment was repeated at least twice with similar results. Representative data are shown. Means with different letters are significantly different at p < 0.05 as determined using XLSTAT ANOVA Tukey HSD test.

